USC total enrollment is approximately 46,287 students. 18,560 are undergraduates and 20,047 are graduate students.
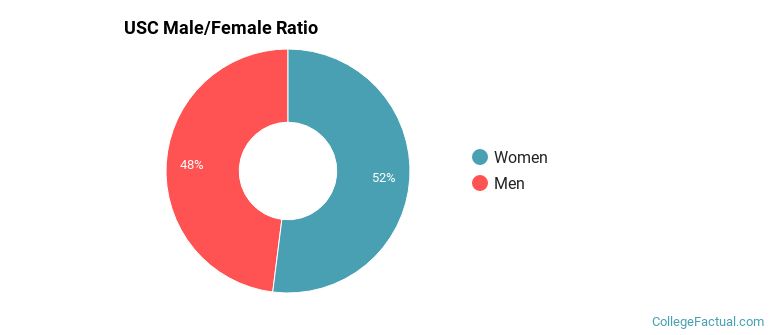
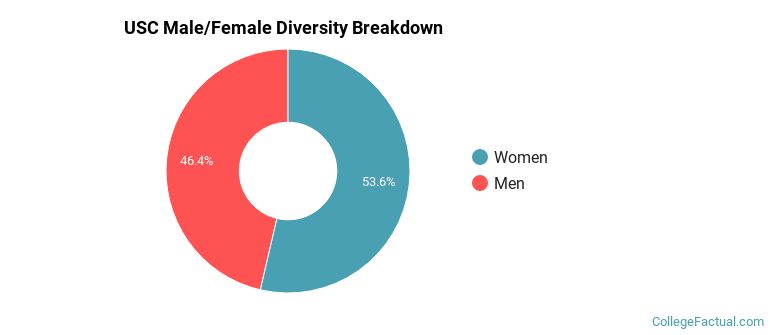
Male/Female Breakdown of Undergraduates
The full-time USC undergraduate population is made up of 52% women, and 48% men.
For the gender breakdown for all students, go here.
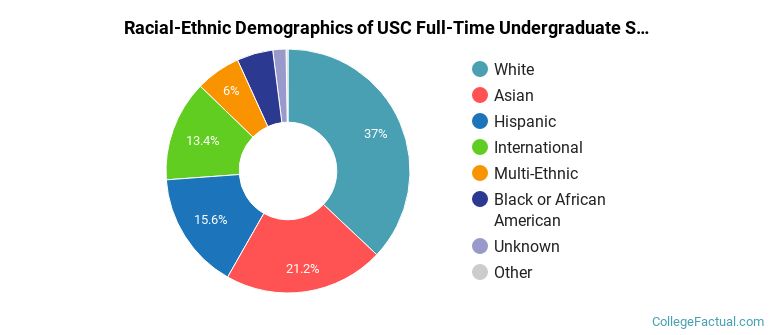
USC Racial/Ethnic Breakdown of Undergraduates
| Race/Ethnicity | Number |
|---|---|
| White | 6,370 |
| Asian | 4,369 |
| Hispanic | 3,095 |
| International | 2,245 |
| Multi-Ethnic | 1,117 |
| Black or African American | 960 |
| Unknown | 326 |
| Native Hawaiian or Pacific Islander | 55 |
See racial/ethnic breakdown for all students.
Male/Female Breakdown of Graduate Students
About 56% of full-time grad students are women, and 44% men.

For the gender breakdown for all students, go here.
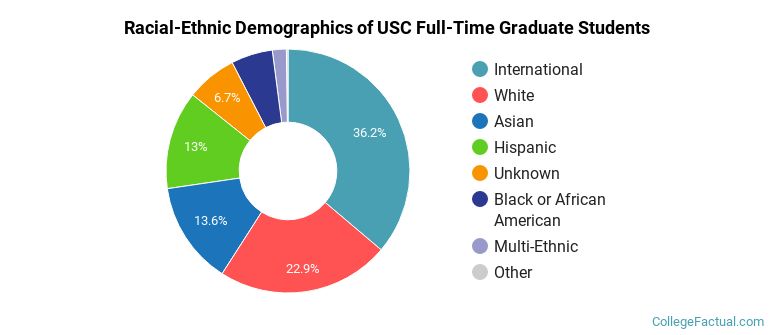
USC Racial-Ethnic Breakdown of Graduate Students
| Race/Ethnicity | Number |
|---|---|
| International | 6,215 |
| White | 5,156 |
| Asian | 3,116 |
| Hispanic | 2,683 |
| Black or African American | 1,187 |
| Unknown | 1,129 |
| Multi-Ethnic | 476 |
| Native Hawaiian or Pacific Islander | 44 |
See racial/ethnic breakdown for all students.
| Race/Ethnicity | Number |
|---|---|
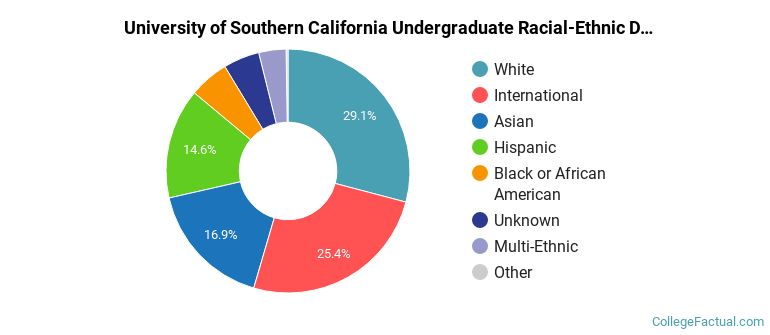
| White | 13,656 |
| International | 10,402 |
| Asian | 8,652 |
| Hispanic | 6,924 |
| Black or African American | 2,535 |
| Unknown | 2,115 |
| Multi-Ethnic | 1,802 |
| Native Hawaiian or Pacific Islander | 122 |
There are approximately 24,920 female students and 21,367 male students at USC.
USC ranks 115 out of 2,183 when it comes to geographic diversity.
49.85% of USC students come from out of state, and 15.19% come from out of the country.
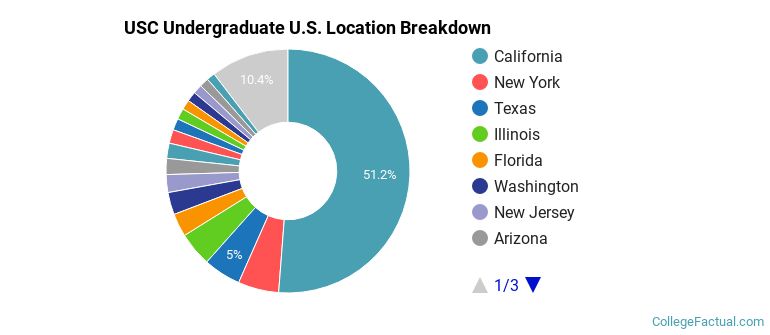
The undergraduate student body is split among 48 states (may include Washington D.C.). Click on the map for more detail.

| State | Amount |
|---|---|
| California | 1,299 |
| New York | 137 |
| Texas | 126 |
| Illinois | 115 |
| Florida | 78 |
Students from 130 countries are represented at this school, with the majority of the international students coming from China, India, and South Korea.
Learn more about international students at USC.
A traditional college student is defined as being between the ages of 18-21. At USC, 35.98% of students fall into that category, compared to the national average of 60%.

| Student Age Group | Amount |
|---|---|
| 22-24 | 11,040 |
| 25-29 | 9,747 |
| 20-21 | 9,302 |
| 18-19 | 7,138 |
| 35 and over | 4,177 |
| 30-34 | 3,887 |
| Under 18 | 0 |
Footnotes
*The racial-ethnic minorities count is calculated by taking the total number of students and subtracting white students, international students, and students whose race/ethnicity was unknown. This number is then divided by the total number of students at the school to obtain the racial-ethnic minorities percentage.
References
Department of Homeland Security Citizenship and Immigration Services
Image Credit: By Original uploader was Padsquad19 at en.wikipedia under License
Learn more about how College Factual creates their Diversity Rankings.