USI total enrollment is approximately 10,203 students. 5,767 are undergraduates and 406 are graduate students.
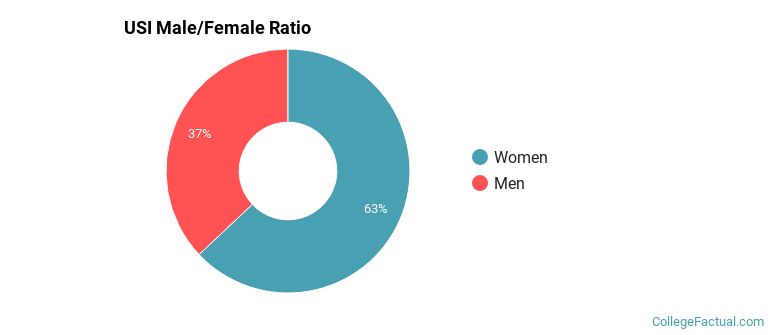
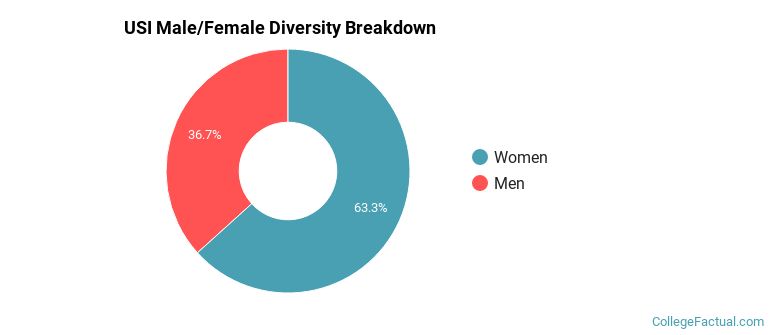
Male/Female Breakdown of Undergraduates
The full-time USI undergraduate population is made up of 63% women, and 37% men.
For the gender breakdown for all students, go here.
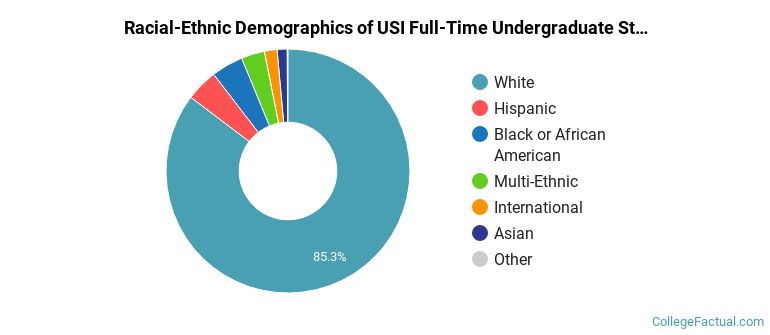
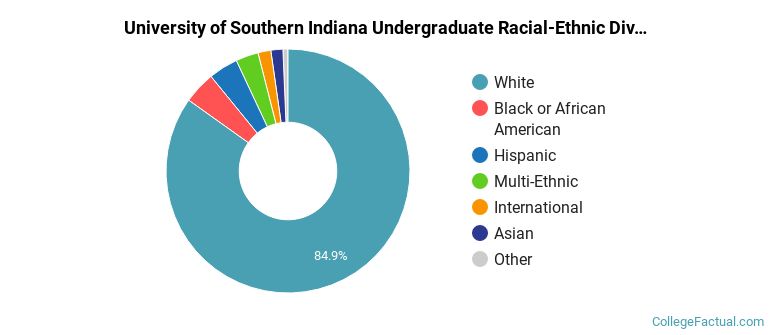
USI Racial/Ethnic Breakdown of Undergraduates
| Race/Ethnicity | Number |
|---|---|
| White | 4,924 |
| Hispanic | 245 |
| Black or African American | 235 |
| Multi-Ethnic | 176 |
| Asian | 89 |
| International | 82 |
| Unknown | 6 |
| Native Hawaiian or Pacific Islander | 4 |
See racial/ethnic breakdown for all students.
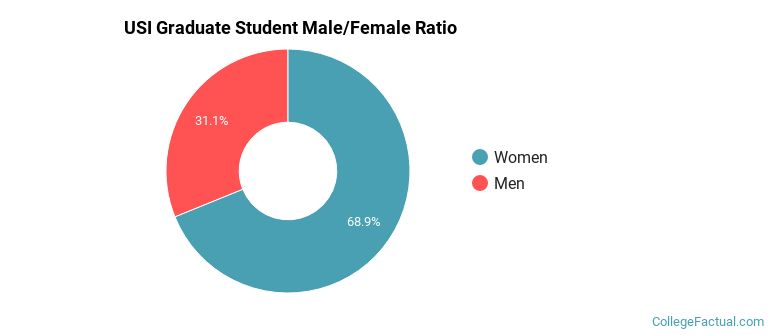
Male/Female Breakdown of Graduate Students
About 65% of full-time grad students are women, and 35% men.
For the gender breakdown for all students, go here.
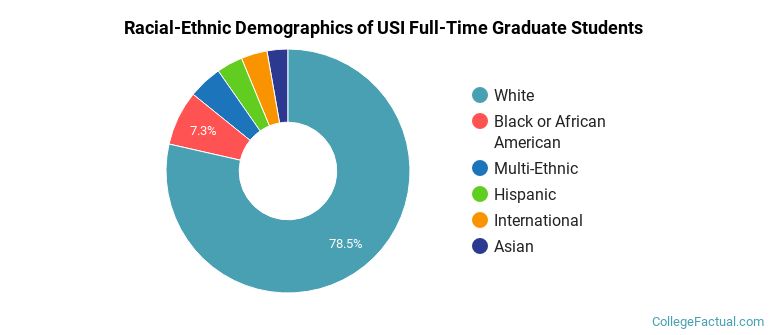
USI Racial-Ethnic Breakdown of Graduate Students
| Race/Ethnicity | Number |
|---|---|
| White | 318 |
| Black or African American | 31 |
| Hispanic | 15 |
| International | 15 |
| Asian | 13 |
| Multi-Ethnic | 13 |
| Native Hawaiian or Pacific Islander | 0 |
| Unknown | 0 |
See racial/ethnic breakdown for all students.
| Race/Ethnicity | Number |
|---|---|
| White | 8,607 |
| Black or African American | 436 |
| Hispanic | 421 |
| Multi-Ethnic | 297 |
| Asian | 213 |
| International | 155 |
| Unknown | 56 |
| Native Hawaiian or Pacific Islander | 6 |
There are approximately 6,442 female students and 3,761 male students at USI.
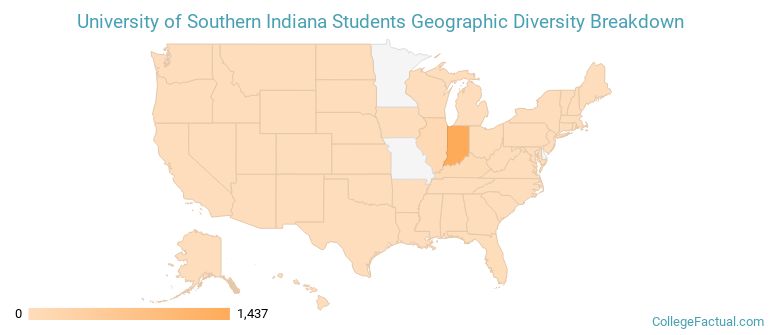
USI ranks 1,420 out of 2,183 when it comes to geographic diversity.
13.9% of USI students come from out of state, and 0.71% come from out of the country.
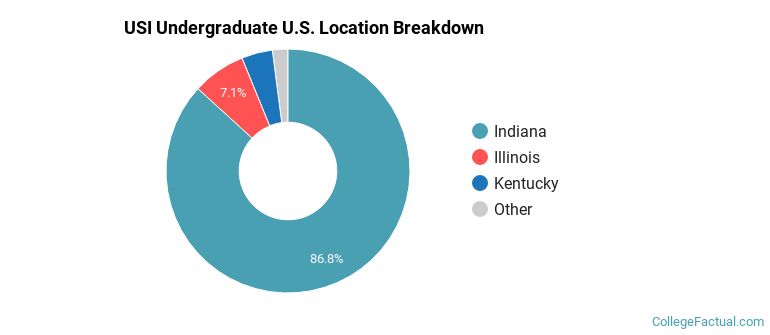
The undergraduate student body is split among 16 states (may include Washington D.C.). Click on the map for more detail.
| State | Amount |
|---|---|
| Indiana | 1,437 |
| Illinois | 117 |
| Kentucky | 68 |
| Ohio | 11 |
| Florida | 9 |
Students from 48 countries are represented at this school, with the majority of the international students coming from Saudi Arabia, Mexico, and China.
Learn more about international students at USI.
A traditional college student is defined as being between the ages of 18-21. At USI, 49.31% of students fall into that category, compared to the national average of 60%.
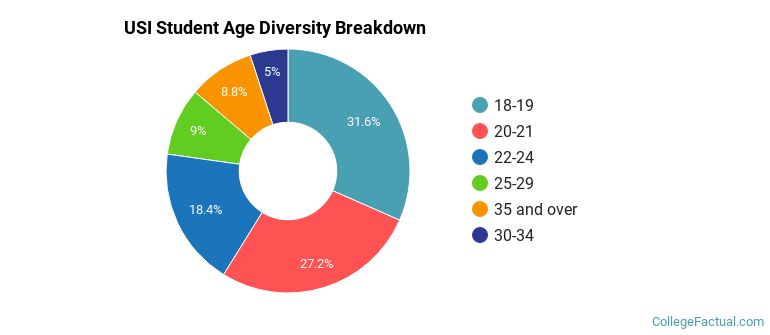
| Student Age Group | Amount |
|---|---|
| 18-19 | 2,914 |
| 20-21 | 2,512 |
| 22-24 | 1,693 |
| 25-29 | 829 |
| 35 and over | 808 |
| 30-34 | 464 |
| Under 18 | 0 |
Footnotes
*The racial-ethnic minorities count is calculated by taking the total number of students and subtracting white students, international students, and students whose race/ethnicity was unknown. This number is then divided by the total number of students at the school to obtain the racial-ethnic minorities percentage.
References
Department of Homeland Security Citizenship and Immigration Services
Find out how College Factual created their Diversity Rankings.