Southern Miss total enrollment is approximately 14,606 students. 9,644 are undergraduates and 1,486 are graduate students.
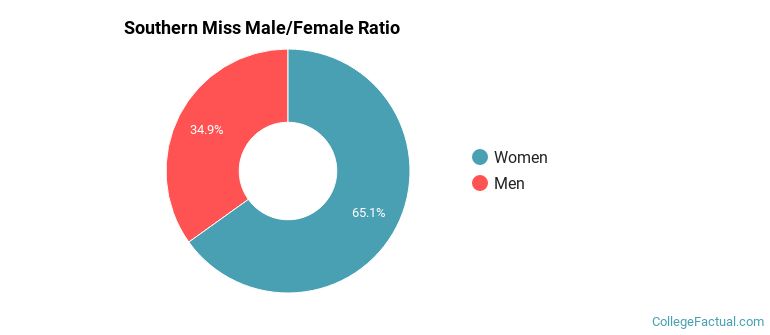
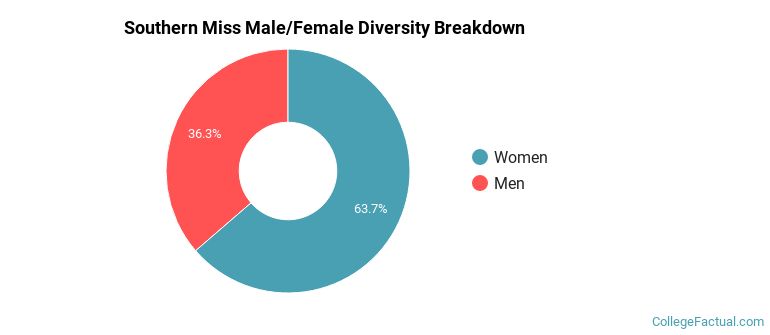
Male/Female Breakdown of Undergraduates
The full-time Southern Miss undergraduate population is made up of 66% women, and 34% men.
For the gender breakdown for all students, go here.
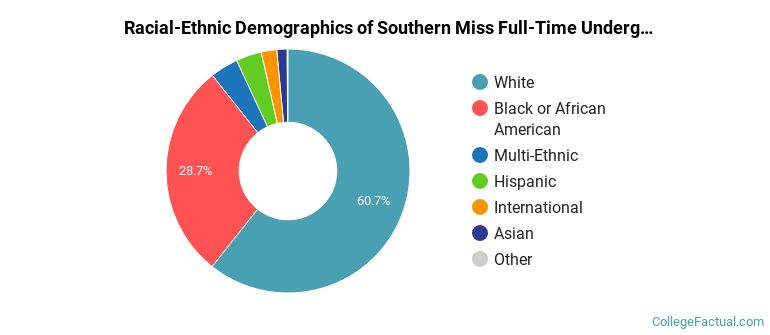
Southern Miss Racial/Ethnic Breakdown of Undergraduates
| Race/Ethnicity | Number |
|---|---|
| White | 5,802 |
| Black or African American | 2,820 |
| Hispanic | 351 |
| Multi-Ethnic | 344 |
| International | 152 |
| Asian | 127 |
| Native Hawaiian or Pacific Islander | 10 |
| Unknown | 1 |
See racial/ethnic breakdown for all students.
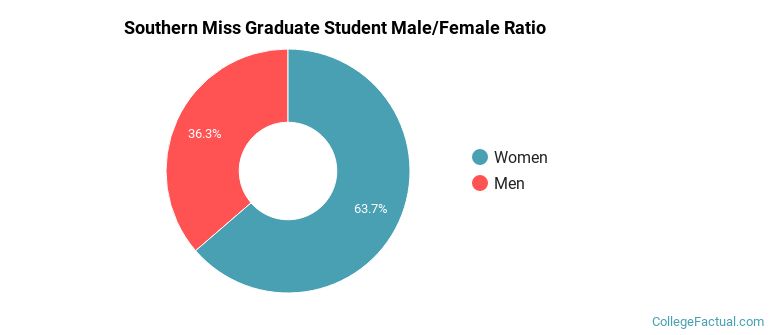
Male/Female Breakdown of Graduate Students
About 64% of full-time grad students are women, and 36% men.
For the gender breakdown for all students, go here.
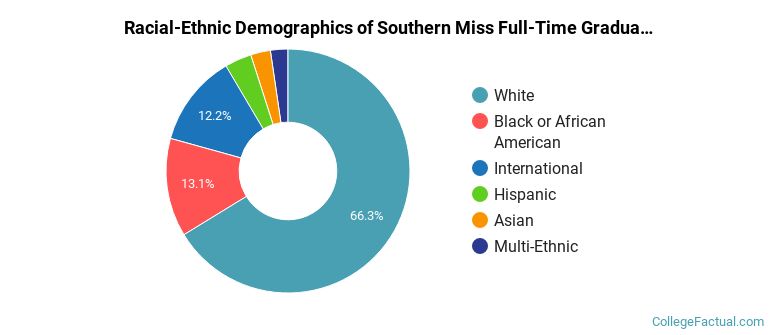
Southern Miss Racial-Ethnic Breakdown of Graduate Students
| Race/Ethnicity | Number |
|---|---|
| White | 964 |
| Black or African American | 246 |
| International | 149 |
| Hispanic | 43 |
| Asian | 42 |
| Multi-Ethnic | 31 |
| Unknown | 7 |
| Native Hawaiian or Pacific Islander | 0 |
See racial/ethnic breakdown for all students.

| Race/Ethnicity | Number |
|---|---|
| White | 8,974 |
| Black or African American | 3,991 |
| Hispanic | 545 |
| Multi-Ethnic | 456 |
| International | 321 |
| Asian | 231 |
| Unknown | 14 |
| Native Hawaiian or Pacific Islander | 13 |
There are approximately 9,408 female students and 5,198 male students at Southern Miss.
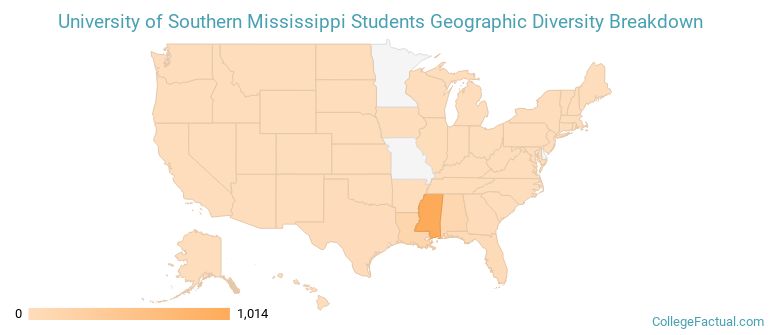
Southern Miss ranks 742 out of 2,183 when it comes to geographic diversity.
29.14% of Southern Miss students come from out of state, and 8.15% come from out of the country.

The undergraduate student body is split among 27 states (may include Washington D.C.). Click on the map for more detail.
| State | Amount |
|---|---|
| Mississippi | 1,014 |
| Louisiana | 151 |
| Alabama | 136 |
| Florida | 41 |
| Georgia | 15 |
Students from 70 countries are represented at this school, with the majority of the international students coming from India, Nepal, and China.
Learn more about international students at Southern Miss.
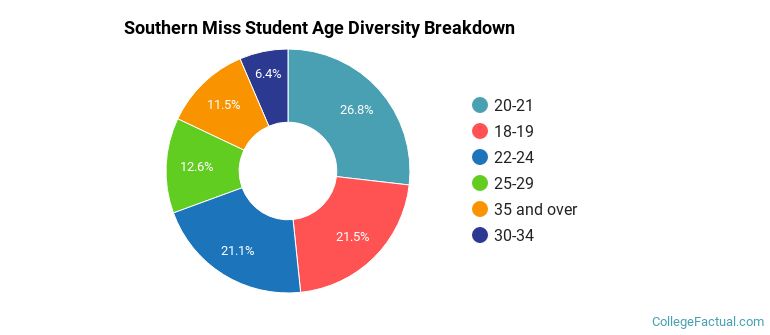
A traditional college student is defined as being between the ages of 18-21. At Southern Miss, 47.58% of students fall into that category, compared to the national average of 60%.
| Student Age Group | Amount |
|---|---|
| 20-21 | 3,823 |
| 18-19 | 3,066 |
| 22-24 | 3,002 |
| 25-29 | 1,798 |
| 35 and over | 1,643 |
| 30-34 | 917 |
| Under 18 | 0 |
Footnotes
*The racial-ethnic minorities count is calculated by taking the total number of students and subtracting white students, international students, and students whose race/ethnicity was unknown. This number is then divided by the total number of students at the school to obtain the racial-ethnic minorities percentage.
References
Department of Homeland Security Citizenship and Immigration Services
Image Credit: By Dudemanfellabra under License