UVM total enrollment is approximately 13,292 students. 10,235 are undergraduates and 1,608 are graduate students.
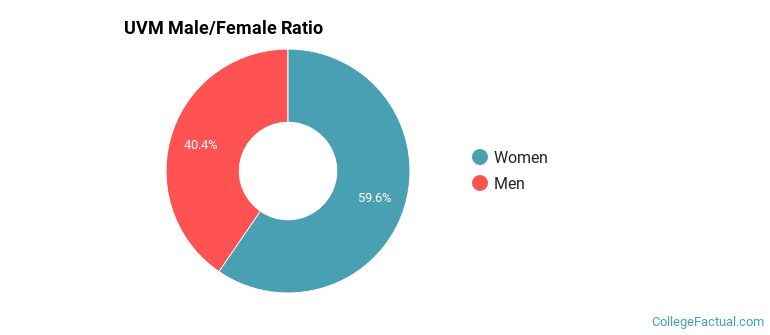
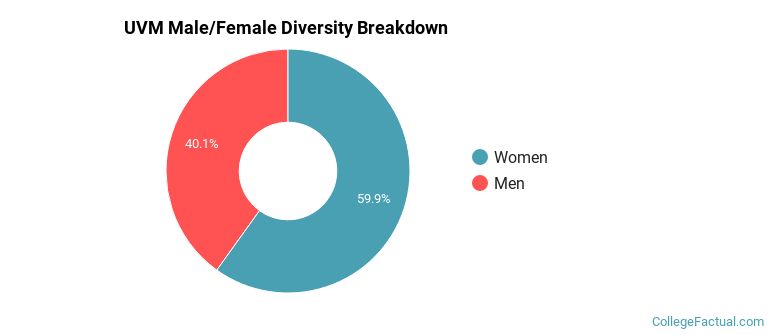
Male/Female Breakdown of Undergraduates
The full-time UVM undergraduate population is made up of 61% women, and 39% men.
For the gender breakdown for all students, go here.
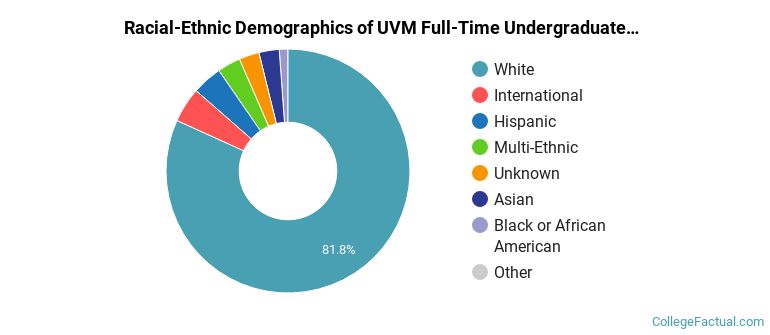
UVM Racial/Ethnic Breakdown of Undergraduates
| Race/Ethnicity | Number |
|---|---|
| White | 8,413 |
| Hispanic | 464 |
| Multi-Ethnic | 332 |
| Asian | 303 |
| Unknown | 302 |
| International | 290 |
| Black or African American | 128 |
| Native Hawaiian or Pacific Islander | 0 |
See racial/ethnic breakdown for all students.
Male/Female Breakdown of Graduate Students
About 58% of full-time grad students are women, and 42% men.

For the gender breakdown for all students, go here.
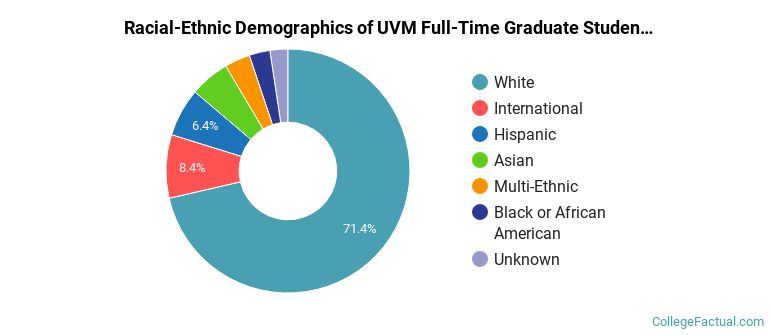
UVM Racial-Ethnic Breakdown of Graduate Students
| Race/Ethnicity | Number |
|---|---|
| White | 1,130 |
| International | 126 |
| Hispanic | 101 |
| Asian | 100 |
| Multi-Ethnic | 66 |
| Black or African American | 47 |
| Unknown | 32 |
| Native Hawaiian or Pacific Islander | 1 |
See racial/ethnic breakdown for all students.
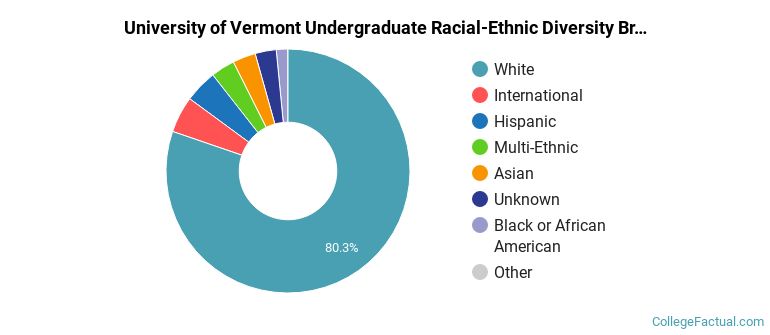
| Race/Ethnicity | Number |
|---|---|
| White | 10,685 |
| Hispanic | 654 |
| Multi-Ethnic | 450 |
| International | 446 |
| Asian | 444 |
| Unknown | 379 |
| Black or African American | 222 |
| Native Hawaiian or Pacific Islander | 2 |
There are approximately 8,073 female students and 5,219 male students at UVM.
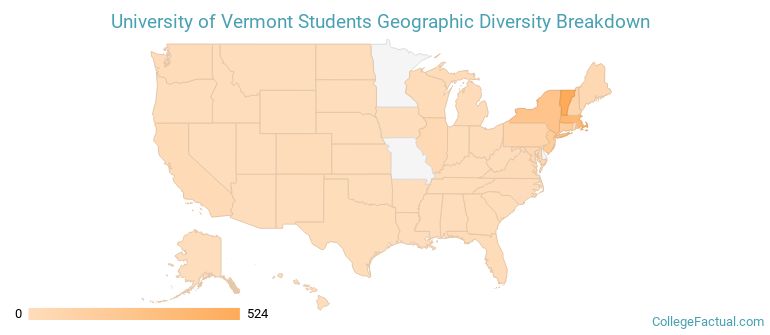
UVM ranks 241 out of 2,183 when it comes to geographic diversity.
62.49% of UVM students come from out of state, and 1.04% come from out of the country.
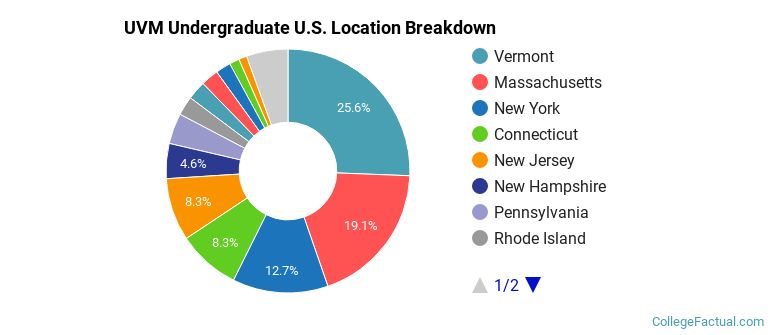
The undergraduate student body is split among 38 states (may include Washington D.C.). Click on the map for more detail.
| State | Amount |
|---|---|
| Vermont | 524 |
| Massachusetts | 390 |
| New York | 259 |
| Connecticut | 170 |
| New Jersey | 170 |
Students from 70 countries are represented at this school, with the majority of the international students coming from China, Canada, and India.
Learn more about international students at UVM.
A traditional college student is defined as being between the ages of 18-21. At UVM, 70.66% of students fall into that category, compared to the national average of 60%.
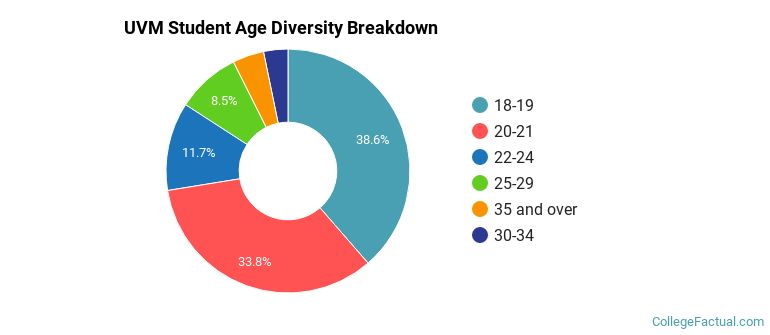
| Student Age Group | Amount |
|---|---|
| 18-19 | 5,024 |
| 20-21 | 4,402 |
| 22-24 | 1,522 |
| 25-29 | 1,102 |
| 35 and over | 542 |
| 30-34 | 420 |
| Under 18 | 0 |
Footnotes
*The racial-ethnic minorities count is calculated by taking the total number of students and subtracting white students, international students, and students whose race/ethnicity was unknown. This number is then divided by the total number of students at the school to obtain the racial-ethnic minorities percentage.
References
Department of Homeland Security Citizenship and Immigration Services
Image Credit: By AlexiusHoratius under License