We've gathered data and other essential information about the program, such as the average salary of graduates, ethnicity of students, how many students graduated in recent times, and more. In addition, we cover how UW Seattle ranks in comparison to other schools with allied health programs.
Go directly to any of the following sections:
Learn about start dates, transferring credits, availability of financial aid, and more by contacting the universities below.
Take your associate degree in an allied health field to the next level with this specialized transfer friendly online bachelor of science from Southern New Hampshire University.
In College Factual's most recent rankings for the best schools for allied health majors, UW Seattle came in at #14. This puts it in the top 5% of the country in this field of study. It is also ranked #1 in Washington.
| Ranking Type | Rank |
|---|---|
| Best Allied Health Professions Master’s Degree Schools | 8 |
| Best Allied Health Professions Graduate Degree Schools | 9 |
| Best Allied Health Professions Schools | 14 |
During the 2021-2022 academic year, University of Washington - Seattle Campus handed out 3 bachelor's degrees in allied health professions. This is a decrease of 90% over the previous year when 29 degrees were handed out.
In 2022, 97 students received their master’s degree in allied health from UW Seattle. This makes it the #12 most popular school for allied health master’s degree candidates in the country.
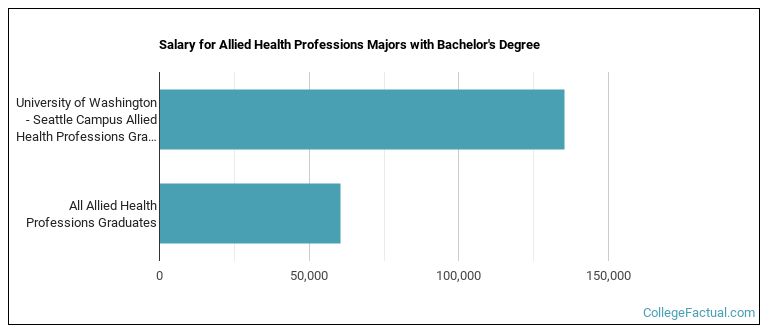
The median salary of allied health students who receive their bachelor's degree at UW Seattle is $135,384. This is great news for graduates of the program, since this figure is higher than the national average of $60,597 for all allied health bachelor's degree recipients.
Out-of-state part-time undergraduates at UW Seattle paid an average of $1,363 per credit hour in 2022-2023. The average for in-state students was $384 per credit hour. Information about average full-time undergraduate tuition and fees is shown in the table below.
| In State | Out of State | |
|---|---|---|
| Tuition | $11,524 | $40,878 |
| Fees | $1,119 | $1,119 |
| Books and Supplies | $900 | $900 |
| On Campus Room and Board | $17,982 | $17,982 |
| On Campus Other Expenses | $3,027 | $3,027 |
Learn more about UW Seattle tuition and fees.
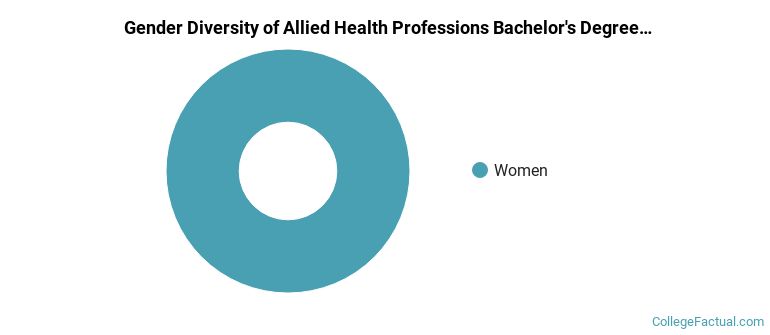
All of the 3 students who graduated with a Bachelor’s in allied health from UW Seattle in 2022 were women.
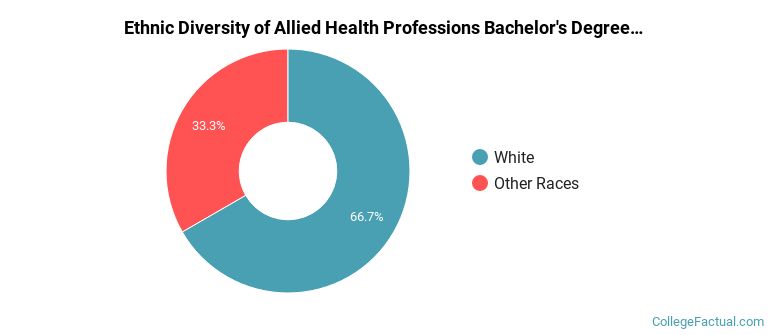
The majority of the students with this major are white. About 67% of 2022 graduates were in this category.
The following table and chart show the ethnic background for students who recently graduated from University of Washington - Seattle Campus with a bachelor's in allied health.
| Ethnic Background | Number of Students |
|---|---|
| Asian | 0 |
| Black or African American | 0 |
| Hispanic or Latino | 0 |
| White | 2 |
| Non-Resident Aliens | 0 |
| Other Races | 1 |
Online degrees for the UW Seattle allied health bachelor’s degree program are not available at this time. To see if the school offers distance learning options in other areas, visit the UW Seattle Online Learning page.
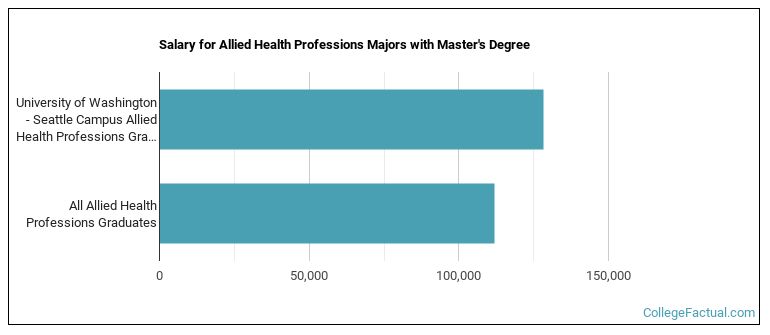
Graduates of the master's allied health program at UW Seattle make a median salary of $128,410. This is a better than average outcome since the median salary for all allied health graduates with a master's is $111,759.
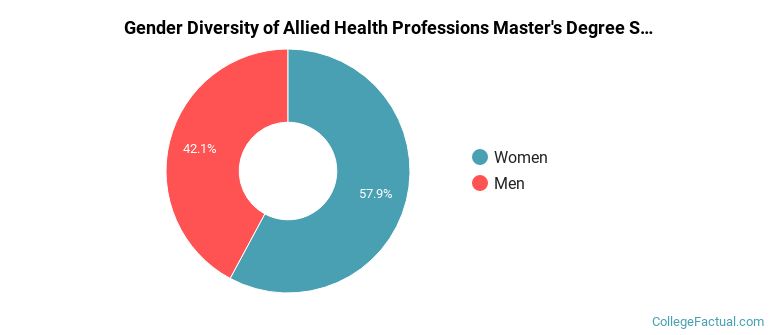
Of the 121 students who earned a master's degree in Allied Health Professions from UW Seattle in 2021-2022, 42% were men and 58% were women.
The majority of the students with this major are white. About 76% of 2022 graduates were in this category.
The following table and chart show the ethnic background for students who recently graduated from University of Washington - Seattle Campus with a master's in allied health.
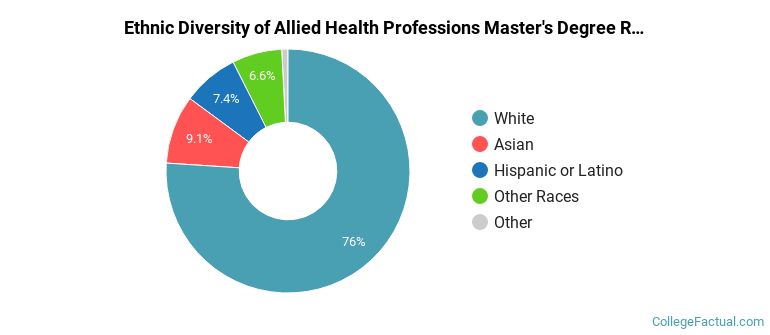
| Ethnic Background | Number of Students |
|---|---|
| Asian | 11 |
| Black or African American | 1 |
| Hispanic or Latino | 9 |
| White | 92 |
| Non-Resident Aliens | 0 |
| Other Races | 8 |
Take a look at the following statistics related to the make-up of the allied health majors at University of Washington - Seattle Campus.
| Related Major | Annual Graduates |
|---|---|
| Public Health | 494 |
| Nursing | 289 |
| Medicine | 255 |
| Pharmacy/Pharmaceutical Sciences | 169 |
| Mental & Social Health Services | 138 |
More about our data sources and methodologies.
