Jump to any of the following sections:
The bachelor's program at UW - Eau Claire was ranked #332 on College Factual's Best Schools for education list. It is also ranked #9 in Wisconsin.
| Ranking Type | Rank |
|---|---|
| Best Education Graduate Certificate Schools | 151 |
| Best Education Schools | 332 |
| Best Education Bachelor’s Degree Schools | 344 |
During the 2021-2022 academic year, University of Wisconsin - Eau Claire handed out 189 bachelor's degrees in education. This is a decrease of 49% over the previous year when 370 degrees were handed out.
In 2022-2023, the average part-time undergraduate tuition at UW - Eau Claire was $704 per credit hour for out-of-state students. The average for in-state students was $319 per credit hour. The average full-time tuition and fees for undergraduates are shown in the table below.
| In State | Out of State | |
|---|---|---|
| Tuition | $7,645 | $16,884 |
| Fees | $1,632 | $1,632 |
| Books and Supplies | $400 | $400 |
| On Campus Room and Board | $9,200 | $9,200 |
| On Campus Other Expenses | $3,366 | $3,366 |
Learn more about UW - Eau Claire tuition and fees.
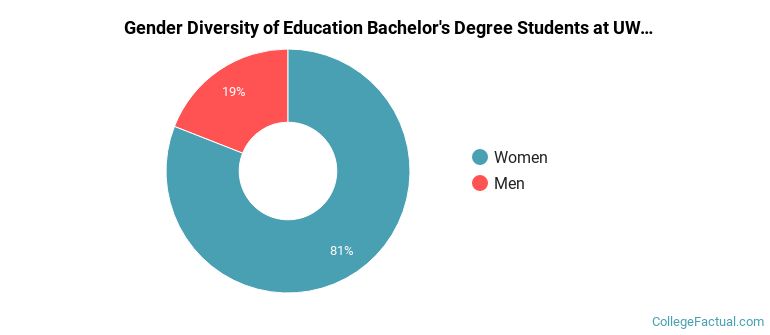
During the 2021-2022 academic year, 189 education majors earned their bachelor's degree from UW - Eau Claire. Of these graduates, 19% were men and 81% were women.
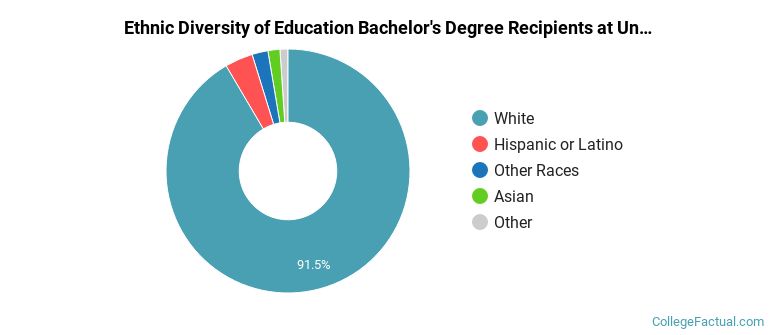
The majority of bachelor's degree recipients in this major at UW - Eau Claire are white. In the most recent graduating class for which data is available, 92% of students fell into this category.
The following table and chart show the ethnic background for students who recently graduated from University of Wisconsin - Eau Claire with a bachelor's in education.
| Ethnic Background | Number of Students |
|---|---|
| Asian | 3 |
| Black or African American | 1 |
| Hispanic or Latino | 7 |
| White | 173 |
| Non-Resident Aliens | 1 |
| Other Races | 4 |
Online degrees for the UW - Eau Claire education bachelor’s degree program are not available at this time. To see if the school offers distance learning options in other areas, visit the UW - Eau Claire Online Learning page.
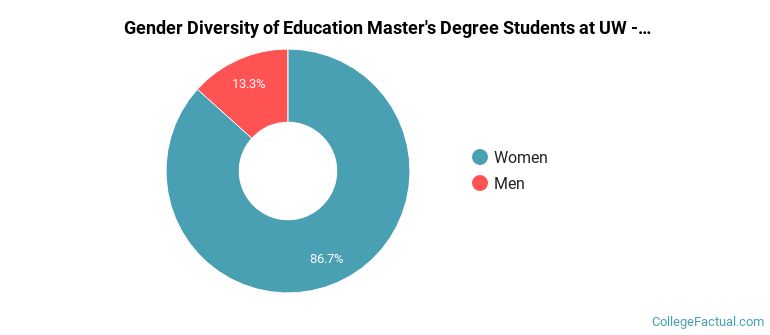
For the most recent academic year available, 13% of education master's degrees went to men and 87% went to women.
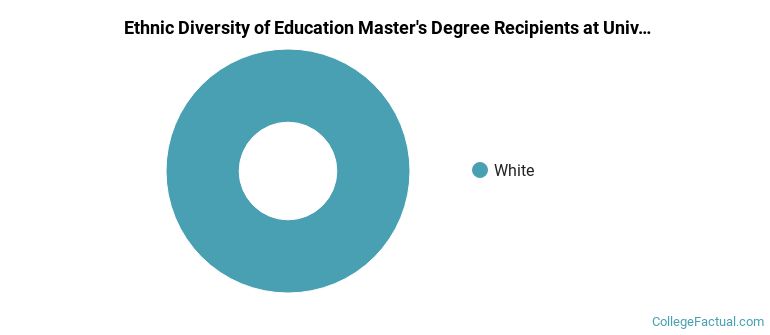
The majority of master's degree recipients in this major at UW - Eau Claire are white. In the most recent graduating class for which data is available, 100% of students fell into this category.
The following table and chart show the ethnic background for students who recently graduated from University of Wisconsin - Eau Claire with a master's in education.
| Ethnic Background | Number of Students |
|---|---|
| Asian | 0 |
| Black or African American | 0 |
| Hispanic or Latino | 0 |
| White | 15 |
| Non-Resident Aliens | 0 |
| Other Races | 0 |
Take a look at the following statistics related to the make-up of the education majors at University of Wisconsin - Eau Claire.
Education students may decide to major in one of the following focus areas. Individual majors may not be available for all degree levels.
| Major | Annual Graduates |
|---|---|
| Special Education | 121 |
| Teacher Education Grade Specific | 95 |
| Teacher Education Subject Specific | 32 |
| Teaching English or French | 8 |
More about our data sources and methodologies.