UW - Eau Claire total enrollment is approximately 11,017 students. 9,436 are undergraduates and 117 are graduate students.
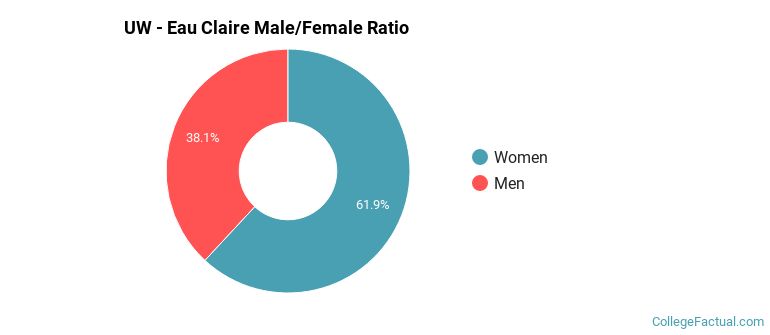
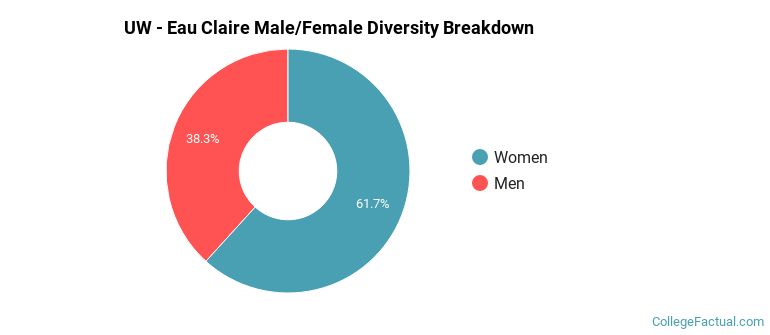
Male/Female Breakdown of Undergraduates
The full-time UW - Eau Claire undergraduate population is made up of 62% women, and 38% men.
For the gender breakdown for all students, go here.
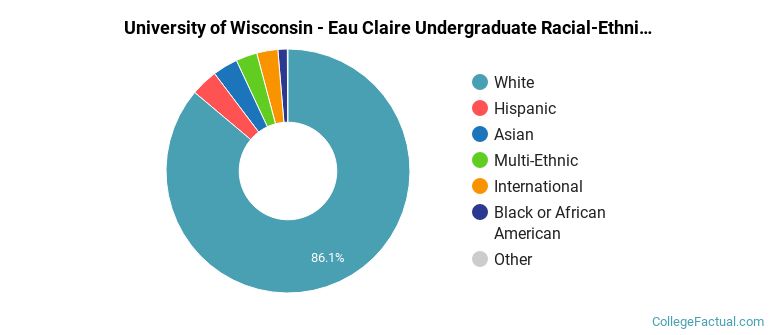
UW - Eau Claire Racial/Ethnic Breakdown of Undergraduates
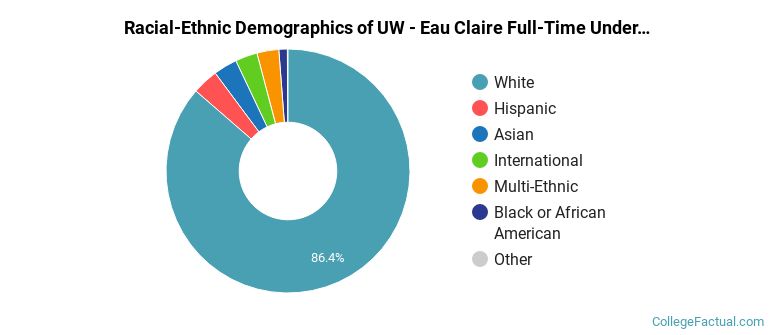
| Race/Ethnicity | Number |
|---|---|
| White | 8,158 |
| Hispanic | 343 |
| Asian | 294 |
| Multi-Ethnic | 294 |
| International | 215 |
| Black or African American | 104 |
| Native Hawaiian or Pacific Islander | 4 |
| Unknown | 3 |
See racial/ethnic breakdown for all students.
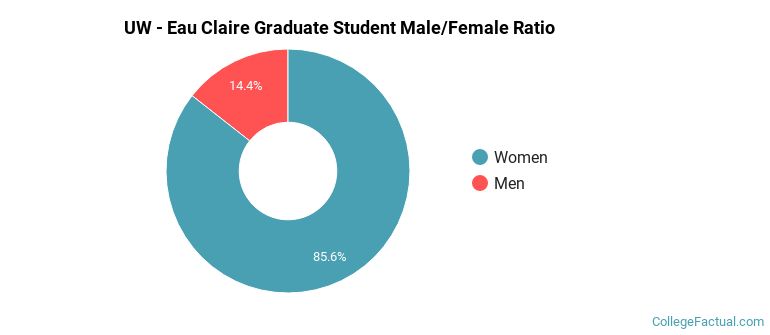
Male/Female Breakdown of Graduate Students
About 90% of full-time grad students are women, and 10% men.
For the gender breakdown for all students, go here.
UW - Eau Claire Racial-Ethnic Breakdown of Graduate Students
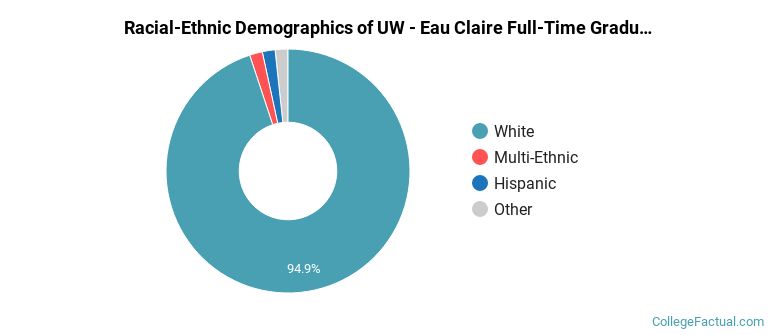
| Race/Ethnicity | Number |
|---|---|
| White | 104 |
| Hispanic | 6 |
| Black or African American | 3 |
| Multi-Ethnic | 3 |
| Asian | 1 |
| Native Hawaiian or Pacific Islander | 0 |
| International | 0 |
| Unknown | 0 |
See racial/ethnic breakdown for all students.
| Race/Ethnicity | Number |
|---|---|
| White | 9,491 |
| Hispanic | 409 |
| Asian | 361 |
| Multi-Ethnic | 338 |
| International | 247 |
| Black or African American | 134 |
| Native Hawaiian or Pacific Islander | 5 |
| Unknown | 3 |
There are approximately 6,777 female students and 4,240 male students at UW - Eau Claire.
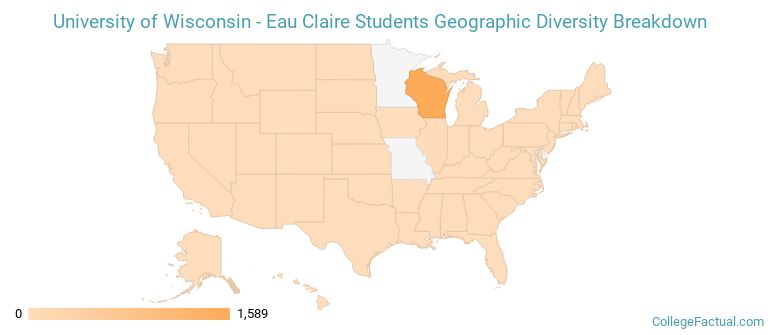
UW - Eau Claire ranks 1,154 out of 2,183 when it comes to geographic diversity.
31.15% of UW - Eau Claire students come from out of state, and 0.43% come from out of the country.
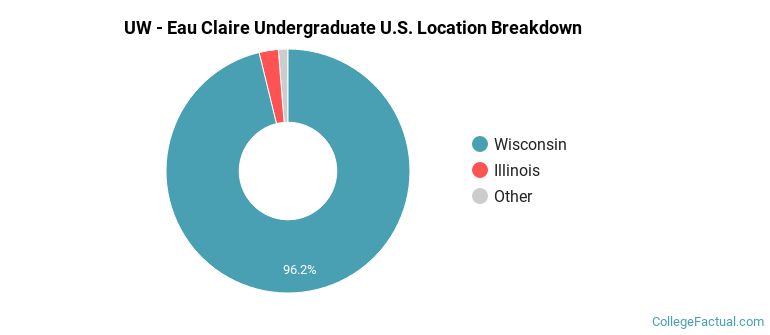
The undergraduate student body is split among 14 states (may include Washington D.C.). Click on the map for more detail.
| State | Amount |
|---|---|
| Wisconsin | 1,589 |
| Illinois | 42 |
| Iowa | 4 |
| Michigan | 4 |
| Arizona | 3 |
Students from 28 countries are represented at this school, with the majority of the international students coming from Malaysia, China, and South Korea.
Learn more about international students at UW - Eau Claire.
A traditional college student is defined as being between the ages of 18-21. At UW - Eau Claire, 74.26% of students fall into that category, compared to the national average of 60%.
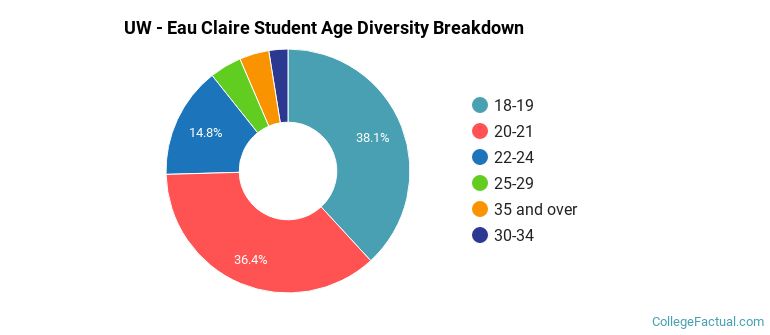
| Student Age Group | Amount |
|---|---|
| 18-19 | 4,142 |
| 20-21 | 3,955 |
| 22-24 | 1,602 |
| 25-29 | 460 |
| 35 and over | 426 |
| 30-34 | 275 |
| Under 18 | 0 |
Footnotes
*The racial-ethnic minorities count is calculated by taking the total number of students and subtracting white students, international students, and students whose race/ethnicity was unknown. This number is then divided by the total number of students at the school to obtain the racial-ethnic minorities percentage.
References
Department of Homeland Security Citizenship and Immigration Services
Image Credit: By Germon prez under License
Read College Factual's Diversity Ranking Methodology.