UW - Madison total enrollment is approximately 44,640 students. 30,063 are undergraduates and 9,824 are graduate students.
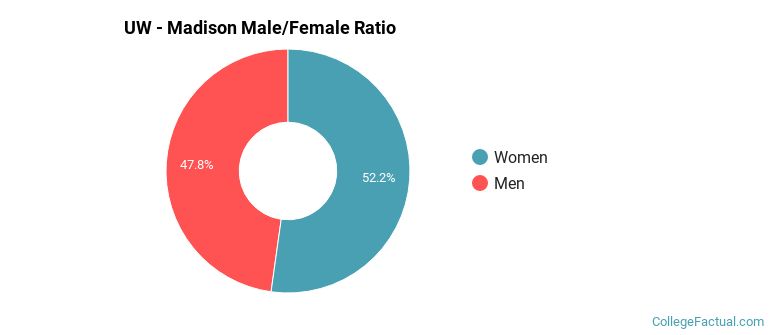
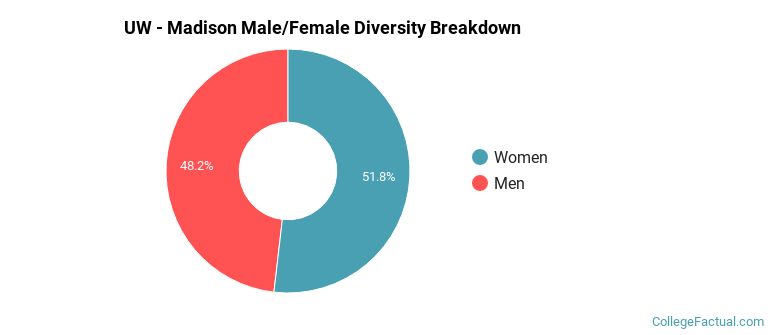
Male/Female Breakdown of Undergraduates
The full-time UW - Madison undergraduate population is made up of 52% women, and 48% men.
For the gender breakdown for all students, go here.
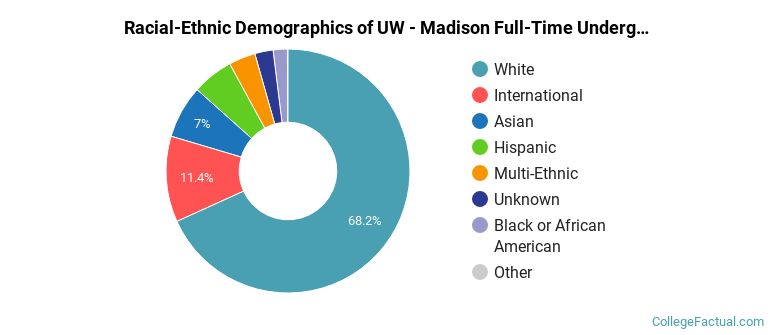
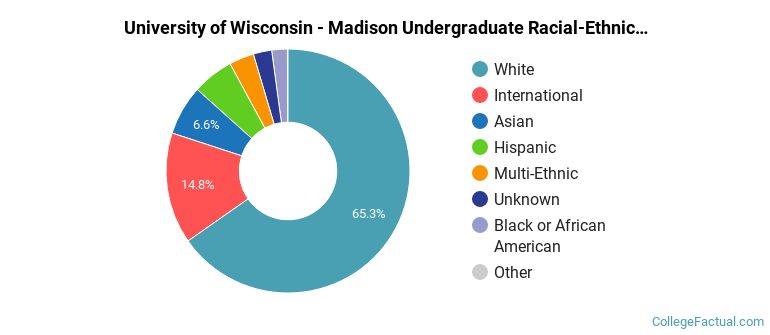
UW - Madison Racial/Ethnic Breakdown of Undergraduates
| Race/Ethnicity | Number |
|---|---|
| White | 20,340 |
| International | 2,848 |
| Asian | 2,362 |
| Hispanic | 1,847 |
| Multi-Ethnic | 1,105 |
| Unknown | 865 |
| Black or African American | 617 |
| Native Hawaiian or Pacific Islander | 19 |
See racial/ethnic breakdown for all students.
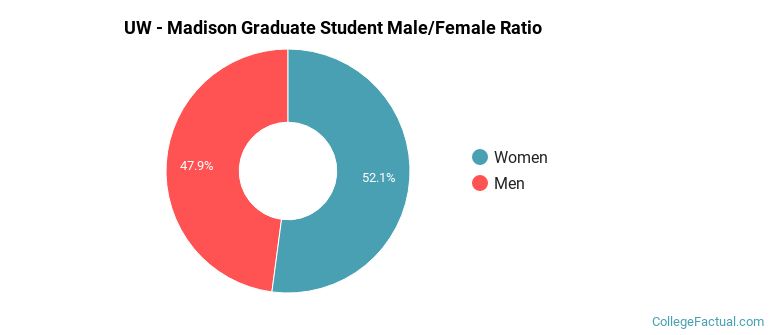
Male/Female Breakdown of Graduate Students
About 52% of full-time grad students are women, and 48% men.
For the gender breakdown for all students, go here.
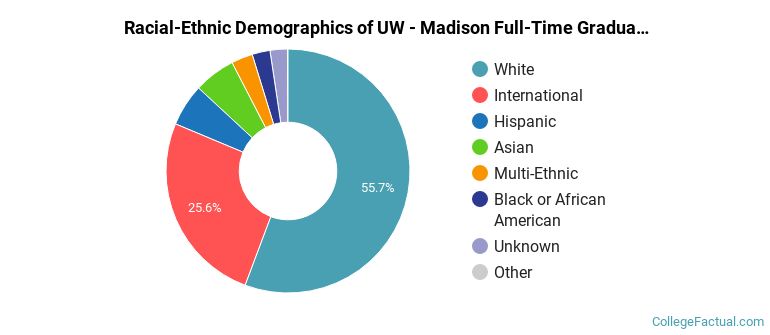
UW - Madison Racial-Ethnic Breakdown of Graduate Students
| Race/Ethnicity | Number |
|---|---|
| White | 5,351 |
| International | 2,457 |
| Hispanic | 621 |
| Asian | 508 |
| Unknown | 329 |
| Multi-Ethnic | 291 |
| Black or African American | 228 |
| Native Hawaiian or Pacific Islander | 9 |
See racial/ethnic breakdown for all students.
| Race/Ethnicity | Number |
|---|---|
| White | 28,837 |
| International | 5,902 |
| Asian | 3,178 |
| Hispanic | 2,729 |
| Multi-Ethnic | 1,518 |
| Unknown | 1,346 |
| Black or African American | 995 |
| Native Hawaiian or Pacific Islander | 31 |
There are approximately 23,281 female students and 21,359 male students at UW - Madison.
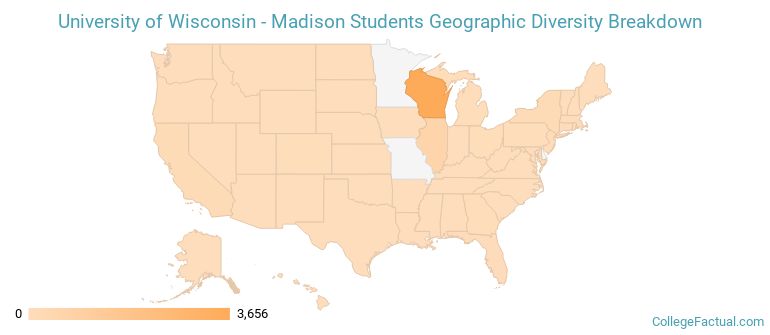
UW - Madison ranks 305 out of 2,183 when it comes to geographic diversity.
37.87% of UW - Madison students come from out of state, and 8.38% come from out of the country.
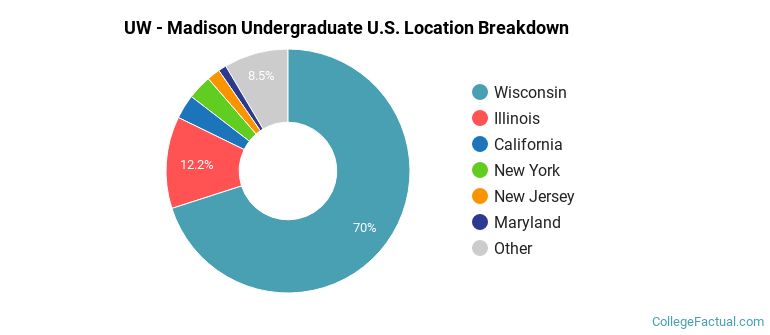
The undergraduate student body is split among 44 states (may include Washington D.C.). Click on the map for more detail.
| State | Amount |
|---|---|
| Wisconsin | 3,656 |
| Illinois | 636 |
| California | 168 |
| New York | 168 |
| New Jersey | 91 |
Students from 110 countries are represented at this school, with the majority of the international students coming from China, India, and South Korea.
Learn more about international students at UW - Madison.
A traditional college student is defined as being between the ages of 18-21. At UW - Madison, 60.03% of students fall into that category, compared to the national average of 60%.
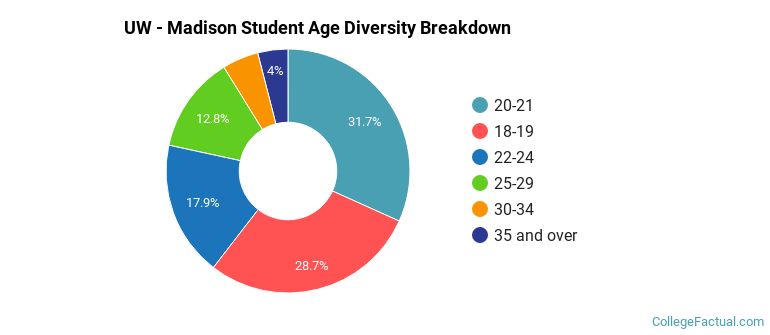
| Student Age Group | Amount |
|---|---|
| 20-21 | 13,538 |
| 18-19 | 12,262 |
| 22-24 | 7,649 |
| 25-29 | 5,456 |
| 30-34 | 2,052 |
| 35 and over | 1,709 |
| Under 18 | 0 |
Footnotes
*The racial-ethnic minorities count is calculated by taking the total number of students and subtracting white students, international students, and students whose race/ethnicity was unknown. This number is then divided by the total number of students at the school to obtain the racial-ethnic minorities percentage.
References
Department of Homeland Security Citizenship and Immigration Services
Find out how College Factual created their Diversity Rankings.