UWM total enrollment is approximately 24,565 students. 16,620 are undergraduates and 2,645 are graduate students.
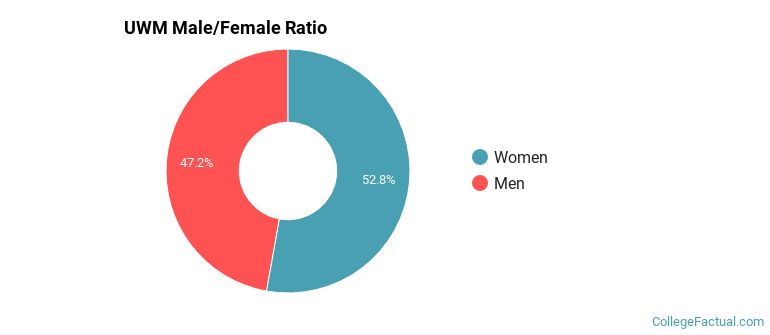
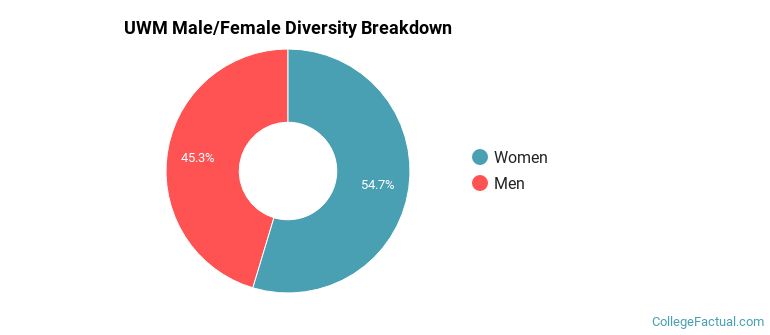
Male/Female Breakdown of Undergraduates
The full-time UWM undergraduate population is made up of 54% women, and 46% men.
For the gender breakdown for all students, go here.
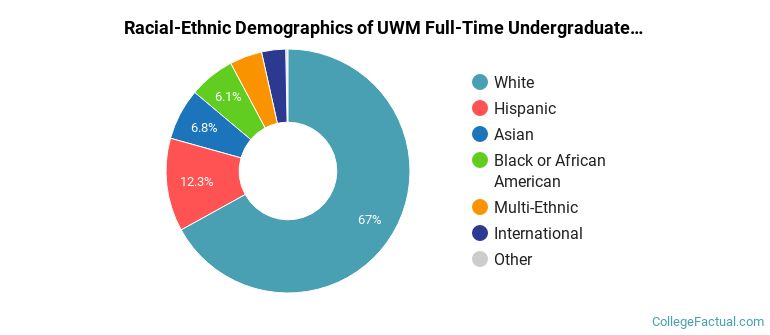
UWM Racial/Ethnic Breakdown of Undergraduates
| Race/Ethnicity | Number |
|---|---|
| White | 10,991 |
| Hispanic | 2,176 |
| Asian | 1,193 |
| Black or African American | 1,015 |
| Multi-Ethnic | 752 |
| International | 394 |
| Unknown | 33 |
| Native Hawaiian or Pacific Islander | 15 |
See racial/ethnic breakdown for all students.
Male/Female Breakdown of Graduate Students
About 61% of full-time grad students are women, and 39% men.

For the gender breakdown for all students, go here.
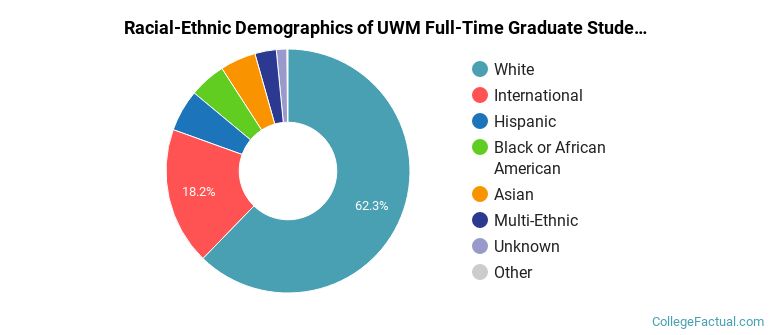
UWM Racial-Ethnic Breakdown of Graduate Students
| Race/Ethnicity | Number |
|---|---|
| White | 1,645 |
| International | 434 |
| Hispanic | 165 |
| Black or African American | 144 |
| Asian | 123 |
| Multi-Ethnic | 76 |
| Unknown | 47 |
| Native Hawaiian or Pacific Islander | 3 |
See racial/ethnic breakdown for all students.
| Race/Ethnicity | Number |
|---|---|
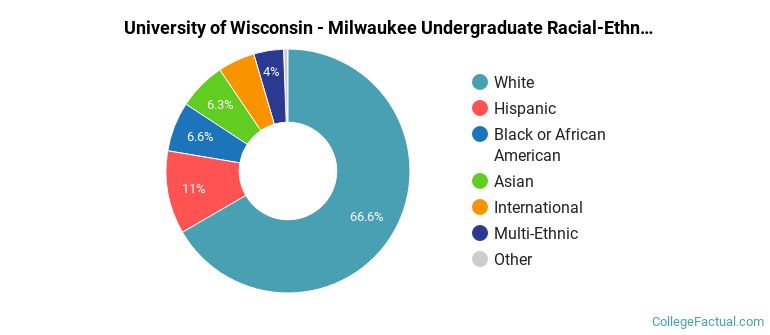
| White | 16,192 |
| Hispanic | 2,913 |
| Black or African American | 1,602 |
| Asian | 1,597 |
| International | 1,018 |
| Multi-Ethnic | 1,010 |
| Unknown | 128 |
| Native Hawaiian or Pacific Islander | 23 |
There are approximately 13,684 female students and 10,881 male students at UWM.
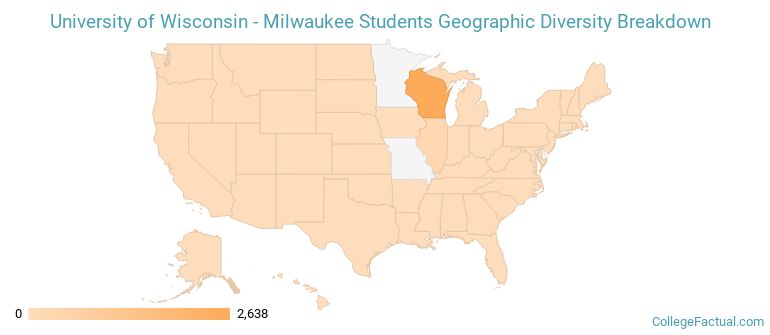
UWM ranks 1,174 out of 2,183 when it comes to geographic diversity.
13.79% of UWM students come from out of state, and 1.8% come from out of the country.
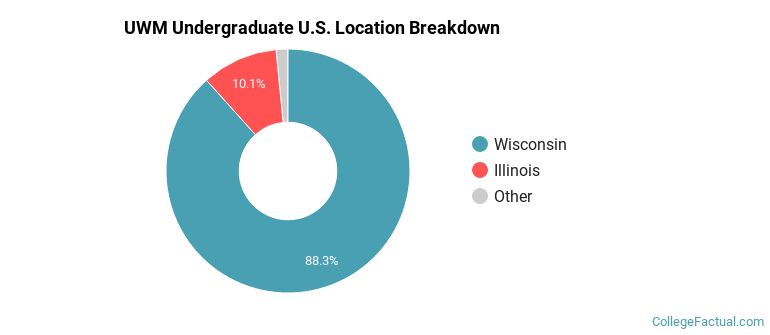
The undergraduate student body is split among 24 states (may include Washington D.C.). Click on the map for more detail.
| State | Amount |
|---|---|
| Wisconsin | 2,638 |
| Illinois | 301 |
| Michigan | 10 |
| California | 5 |
| Indiana | 5 |
Students from 92 countries are represented at this school, with the majority of the international students coming from China, Saudi Arabia, and India.
Learn more about international students at UWM.
A traditional college student is defined as being between the ages of 18-21. At UWM, 45.62% of students fall into that category, compared to the national average of 60%.
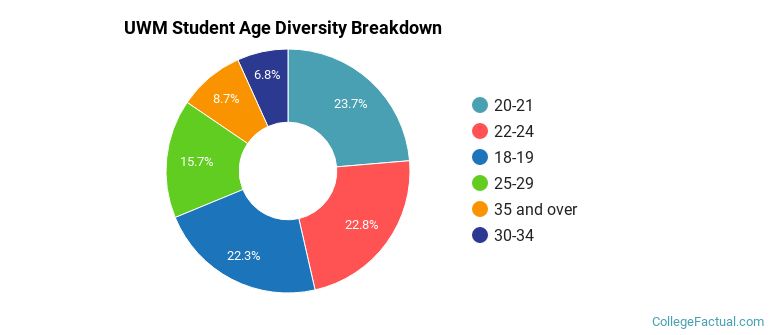
| Student Age Group | Amount |
|---|---|
| 20-21 | 5,863 |
| 22-24 | 5,646 |
| 18-19 | 5,537 |
| 25-29 | 3,897 |
| 35 and over | 2,168 |
| 30-34 | 1,673 |
| Under 18 | 0 |
Footnotes
*The racial-ethnic minorities count is calculated by taking the total number of students and subtracting white students, international students, and students whose race/ethnicity was unknown. This number is then divided by the total number of students at the school to obtain the racial-ethnic minorities percentage.
References