We've gathered data and other essential information about the program, such as the ethnicity of students, how many students graduated in recent times, and more. We've also included details on how UW - Stevens Point ranks compared to other colleges offering a major in health science.
Jump to any of the following sections:
The health science major at UW - Stevens Point is not ranked on College Factual’s Best Colleges and Universities for Health Sciences & Services. This could be for a number of reasons, such as not having enough data on the major or school to make an accurate assessment of its quality.
During the 2021-2022 academic year, University of Wisconsin - Stevens Point handed out 7 bachelor's degrees in health sciences & services. This is an increase of 40% over the previous year when 5 degrees were handed out.
In 2022, 10 students received their master’s degree in health science from UW - Stevens Point. This makes it the #28 most popular school for health science master’s degree candidates in the country.
During the 2022-2023 academic year, part-time undergraduate students at UW - Stevens Point paid an average of $672 per credit hour if they came to the school from out-of-state. In-state students paid a discounted rate of $296 per credit hour. The following table shows the average full-time tuition and fees for undergraduates.
| In State | Out of State | |
|---|---|---|
| Tuition | $7,112 | $16,132 |
| Fees | $1,722 | $1,722 |
| Books and Supplies | $250 | $250 |
| On Campus Room and Board | $8,500 | $8,500 |
| On Campus Other Expenses | $3,322 | $3,322 |
Learn more about UW - Stevens Point tuition and fees.
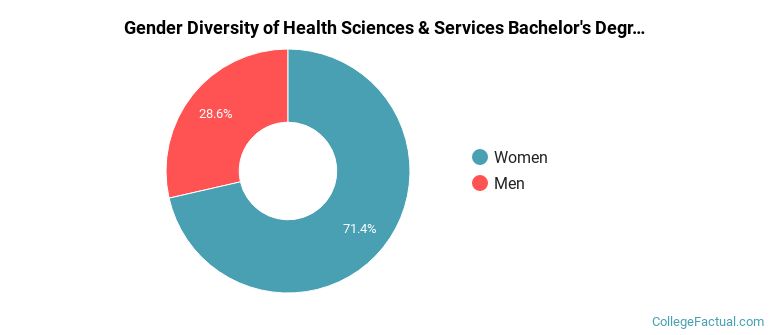
Of the 7 students who earned a bachelor's degree in Health Sciences & Services from UW - Stevens Point in 2021-2022, 29% were men and 71% were women.
The majority of the students with this major are white. About 86% of 2022 graduates were in this category.
The following table and chart show the ethnic background for students who recently graduated from University of Wisconsin - Stevens Point with a bachelor's in health science.

| Ethnic Background | Number of Students |
|---|---|
| Asian | 0 |
| Black or African American | 0 |
| Hispanic or Latino | 0 |
| White | 6 |
| Non-Resident Aliens | 0 |
| Other Races | 1 |
UW - Stevens Point does not offer an online option for its health science bachelor’s degree program at this time. To see if the school offers distance learning options in other areas, visit the UW - Stevens Point Online Learning page.
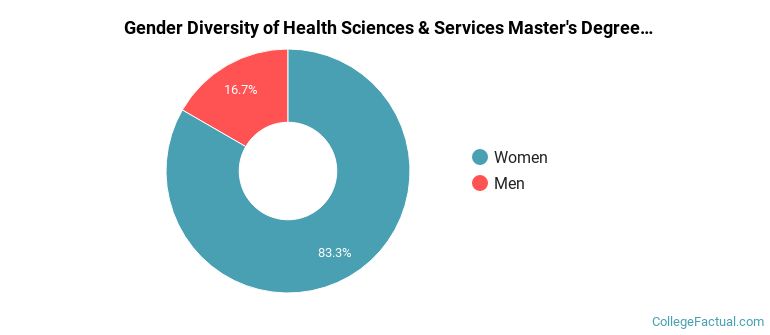
Of the 6 students who earned a master's degree in Health Sciences & Services from UW - Stevens Point in 2021-2022, 17% were men and 83% were women.
The majority of the students with this major are white. About 100% of 2022 graduates were in this category.
The following table and chart show the ethnic background for students who recently graduated from University of Wisconsin - Stevens Point with a master's in health science.
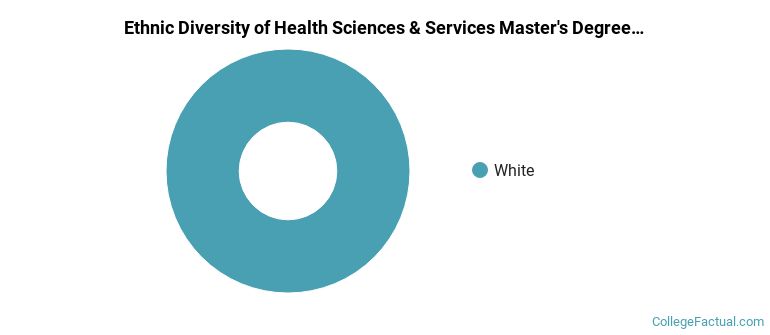
| Ethnic Background | Number of Students |
|---|---|
| Asian | 0 |
| Black or African American | 0 |
| Hispanic or Latino | 0 |
| White | 6 |
| Non-Resident Aliens | 0 |
| Other Races | 0 |
Take a look at the following statistics related to the make-up of the health science majors at University of Wisconsin - Stevens Point.
| Related Major | Annual Graduates |
|---|---|
| Communication Sciences | 71 |
| Other Health Professions | 31 |
| Nursing | 29 |
| Clinical/Medical Laboratory Science | 16 |
| Allied Health Professions | 14 |
More about our data sources and methodologies.