UW - Stout total enrollment is approximately 7,970 students. 5,593 are undergraduates and 241 are graduate students.
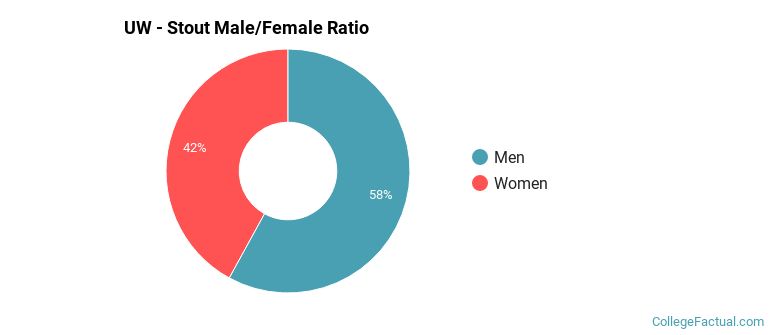
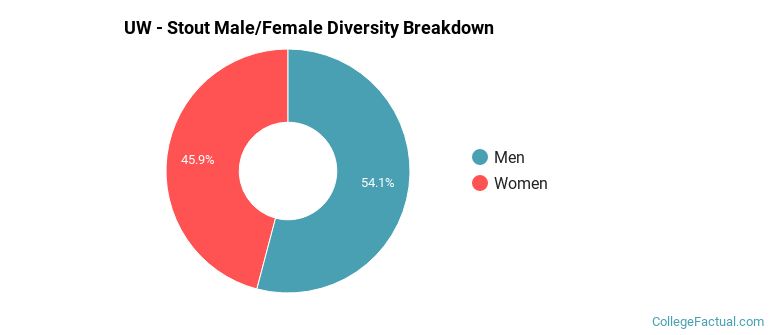
Male/Female Breakdown of Undergraduates
The full-time UW - Stout undergraduate population is made up of 41% women, and 59% men.
For the gender breakdown for all students, go here.
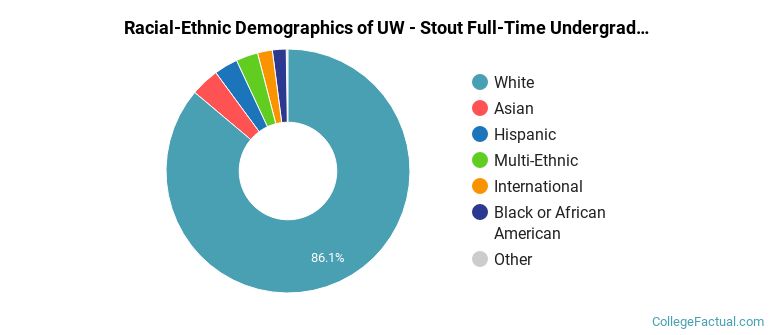
UW - Stout Racial/Ethnic Breakdown of Undergraduates
| Race/Ethnicity | Number |
|---|---|
| White | 4,849 |
| Asian | 201 |
| Hispanic | 199 |
| Multi-Ethnic | 153 |
| Black or African American | 84 |
| International | 71 |
| Unknown | 14 |
| Native Hawaiian or Pacific Islander | 6 |
See racial/ethnic breakdown for all students.
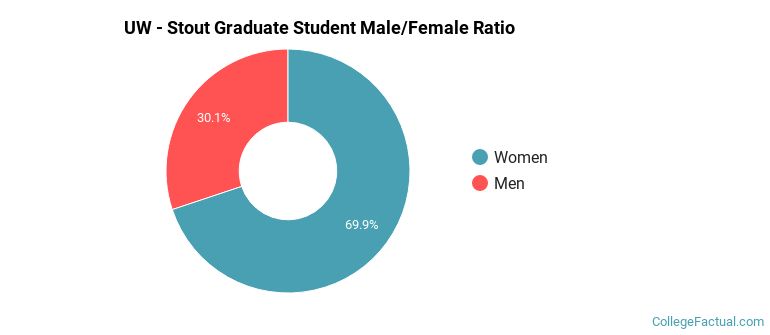
Male/Female Breakdown of Graduate Students
About 73% of full-time grad students are women, and 27% men.
For the gender breakdown for all students, go here.
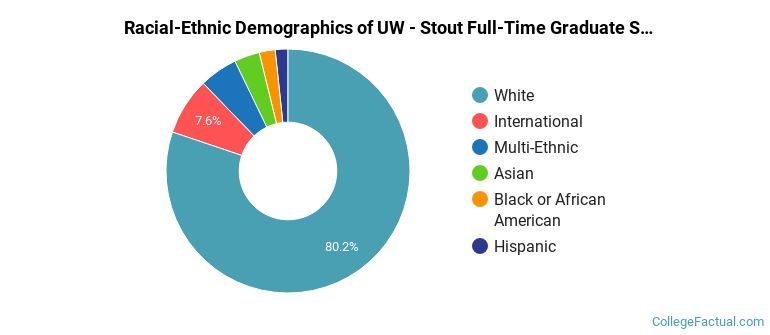
UW - Stout Racial-Ethnic Breakdown of Graduate Students
| Race/Ethnicity | Number |
|---|---|
| White | 202 |
| Multi-Ethnic | 10 |
| International | 9 |
| Asian | 7 |
| Hispanic | 7 |
| Black or African American | 5 |
| Native Hawaiian or Pacific Islander | 0 |
| Unknown | 0 |
See racial/ethnic breakdown for all students.

| Race/Ethnicity | Number |
|---|---|
| White | 6,876 |
| Hispanic | 284 |
| Asian | 281 |
| Multi-Ethnic | 208 |
| Black or African American | 149 |
| International | 109 |
| Unknown | 29 |
| Native Hawaiian or Pacific Islander | 10 |
There are approximately 3,595 female students and 4,375 male students at UW - Stout.
UW - Stout ranks 932 out of 2,183 when it comes to geographic diversity.
38.1% of UW - Stout students come from out of state, and 0.5% come from out of the country.

The undergraduate student body is split among 18 states (may include Washington D.C.). Click on the map for more detail.

| State | Amount |
|---|---|
| Wisconsin | 978 |
| Illinois | 48 |
| California | 6 |
| Michigan | 6 |
| Iowa | 3 |
Students from 37 countries are represented at this school, with the majority of the international students coming from Saudi Arabia, China, and India.
Learn more about international students at UW - Stout.
A traditional college student is defined as being between the ages of 18-21. At UW - Stout, 53.94% of students fall into that category, compared to the national average of 60%.

| Student Age Group | Amount |
|---|---|
| 20-21 | 2,619 |
| 18-19 | 2,460 |
| 22-24 | 1,871 |
| 35 and over | 1,139 |
| 25-29 | 833 |
| 30-34 | 458 |
| Under 18 | 0 |
Footnotes
*The racial-ethnic minorities count is calculated by taking the total number of students and subtracting white students, international students, and students whose race/ethnicity was unknown. This number is then divided by the total number of students at the school to obtain the racial-ethnic minorities percentage.
References
Department of Homeland Security Citizenship and Immigration Services
Image Credit: By Jennanelson02 under License