UW - Superior total enrollment is approximately 2,560 students. 1,570 are undergraduates and 72 are graduate students.
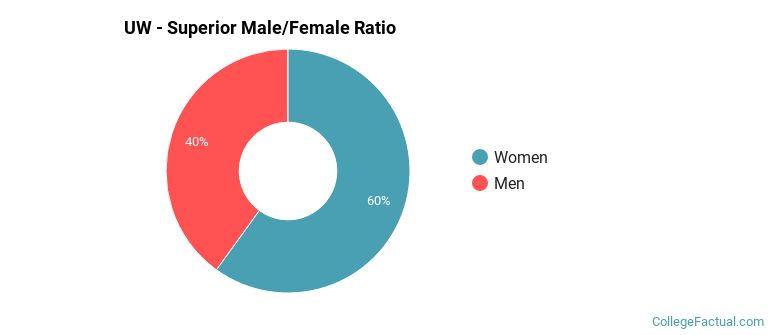
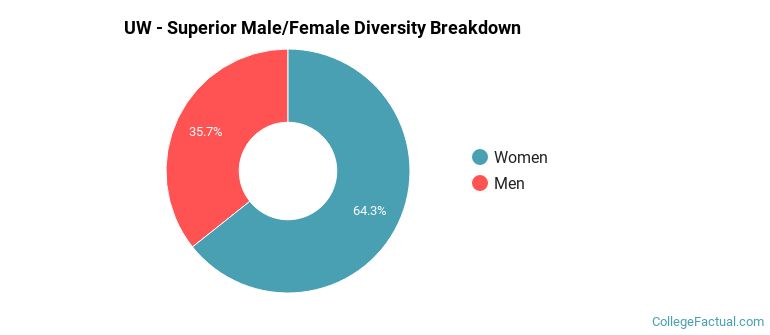
Male/Female Breakdown of Undergraduates
The full-time UW - Superior undergraduate population is made up of 61% women, and 39% men.
For the gender breakdown for all students, go here.
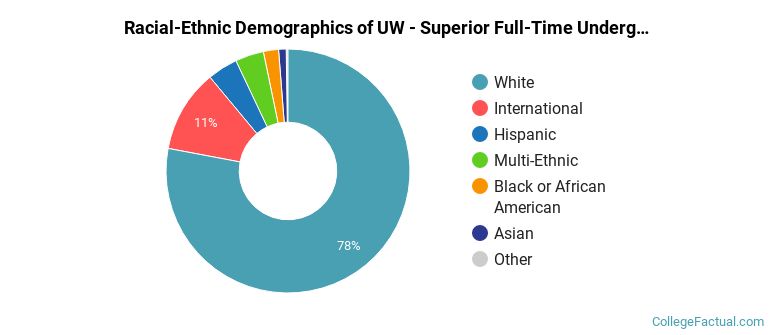
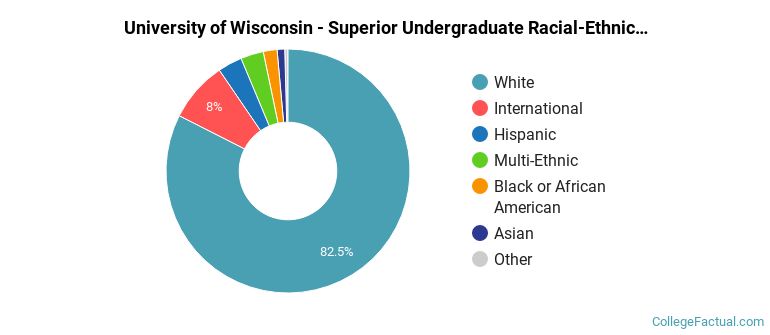
UW - Superior Racial/Ethnic Breakdown of Undergraduates
| Race/Ethnicity | Number |
|---|---|
| White | 1,243 |
| International | 146 |
| Hispanic | 66 |
| Multi-Ethnic | 43 |
| Black or African American | 36 |
| Asian | 10 |
| Native Hawaiian or Pacific Islander | 1 |
| Unknown | 0 |
See racial/ethnic breakdown for all students.
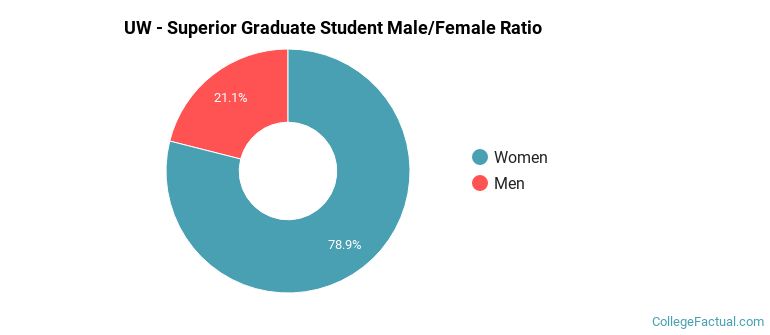
Male/Female Breakdown of Graduate Students
About 68% of full-time grad students are women, and 32% men.
For the gender breakdown for all students, go here.
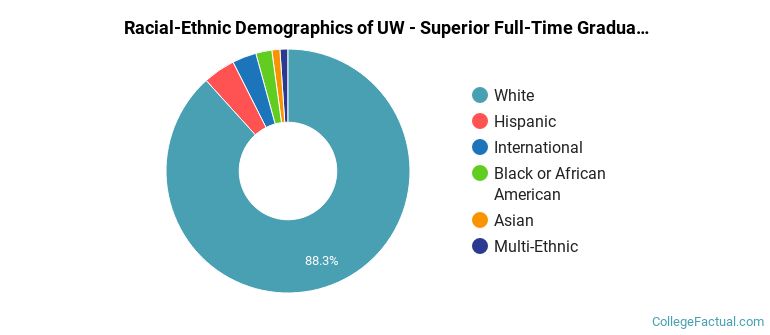
UW - Superior Racial-Ethnic Breakdown of Graduate Students
| Race/Ethnicity | Number |
|---|---|
| White | 68 |
| Asian | 2 |
| Multi-Ethnic | 1 |
| Black or African American | 0 |
| Hispanic | 0 |
| Native Hawaiian or Pacific Islander | 0 |
| International | 0 |
| Unknown | 0 |
See racial/ethnic breakdown for all students.
| Race/Ethnicity | Number |
|---|---|
| White | 2,129 |
| International | 158 |
| Hispanic | 87 |
| Multi-Ethnic | 55 |
| Black or African American | 53 |
| Asian | 27 |
| Unknown | 6 |
| Native Hawaiian or Pacific Islander | 3 |
There are approximately 1,672 female students and 888 male students at UW - Superior.
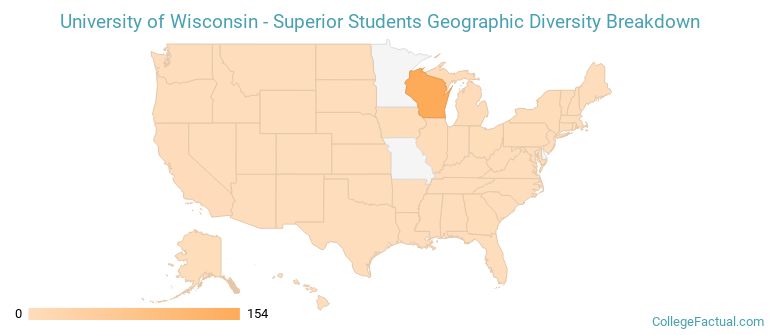
UW - Superior ranks 825 out of 2,183 when it comes to geographic diversity.
52.76% of UW - Superior students come from out of state, and 13.3% come from out of the country.
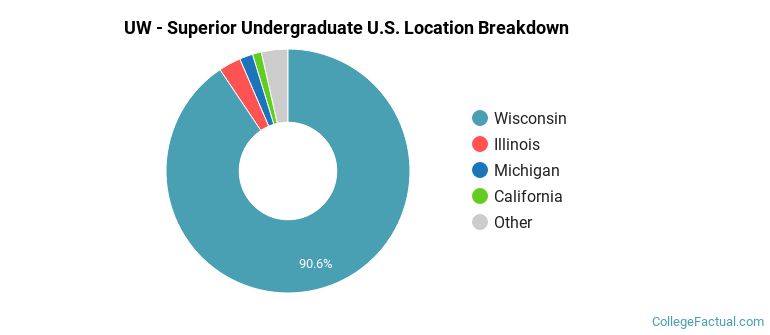
The undergraduate student body is split among 10 states (may include Washington D.C.). Click on the map for more detail.
| State | Amount |
|---|---|
| Wisconsin | 154 |
| Illinois | 5 |
| Michigan | 3 |
| California | 2 |
| Alaska | 1 |
Learn more about international students at UW - Superior.
A traditional college student is defined as being between the ages of 18-21. At UW - Superior, 44.62% of students fall into that category, compared to the national average of 60%.
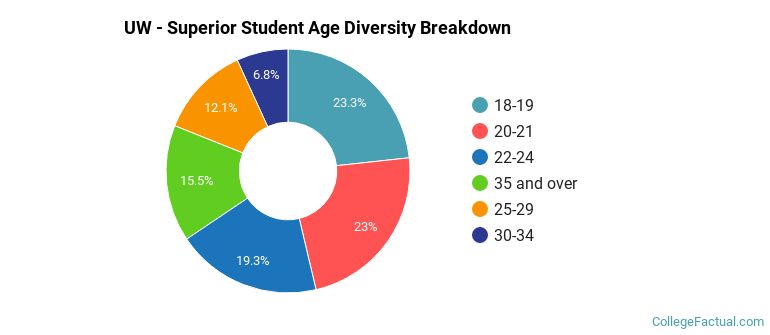
| Student Age Group | Amount |
|---|---|
| 18-19 | 582 |
| 20-21 | 576 |
| 22-24 | 482 |
| 35 and over | 387 |
| 25-29 | 303 |
| 30-34 | 171 |
| Under 18 | 0 |
Footnotes
*The racial-ethnic minorities count is calculated by taking the total number of students and subtracting white students, international students, and students whose race/ethnicity was unknown. This number is then divided by the total number of students at the school to obtain the racial-ethnic minorities percentage.
References
Department of Homeland Security Citizenship and Immigration Services
Image Credit: By Bobak Ha’Eri under License