UW - Whitewater total enrollment is approximately 11,989 students. 8,946 are undergraduates and 504 are graduate students.
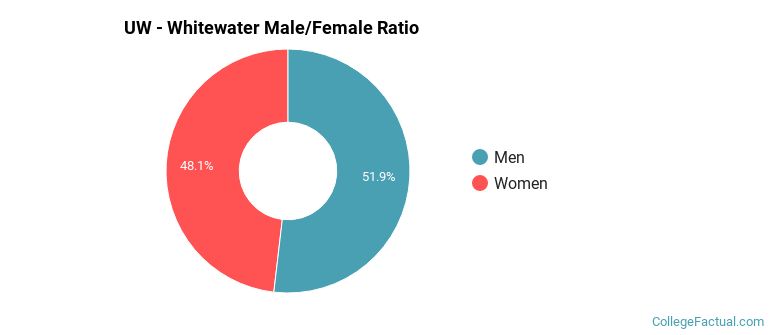
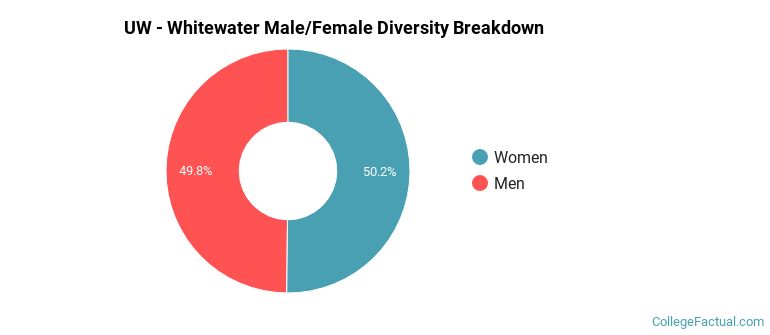
Male/Female Breakdown of Undergraduates
The full-time UW - Whitewater undergraduate population is made up of 49% women, and 51% men.
For the gender breakdown for all students, go here.
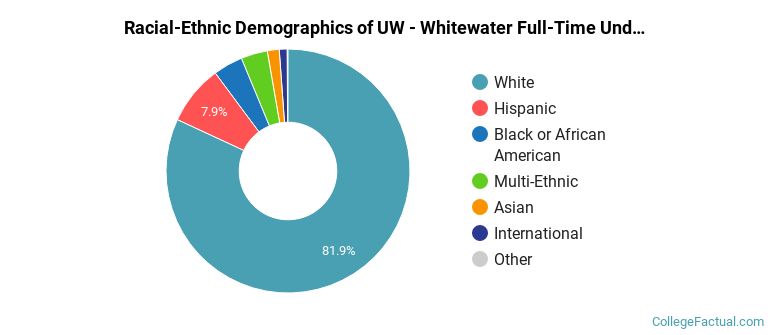
UW - Whitewater Racial/Ethnic Breakdown of Undergraduates
| Race/Ethnicity | Number |
|---|---|
| White | 7,355 |
| Hispanic | 732 |
| Black or African American | 353 |
| Multi-Ethnic | 269 |
| Asian | 159 |
| International | 54 |
| Native Hawaiian or Pacific Islander | 5 |
| Unknown | 4 |
See racial/ethnic breakdown for all students.
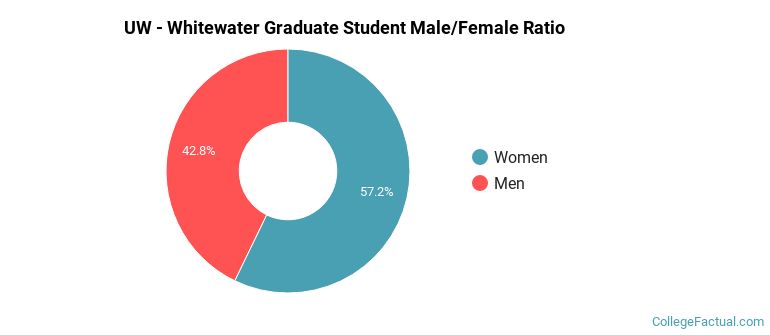
Male/Female Breakdown of Graduate Students
About 63% of full-time grad students are women, and 38% men.
For the gender breakdown for all students, go here.
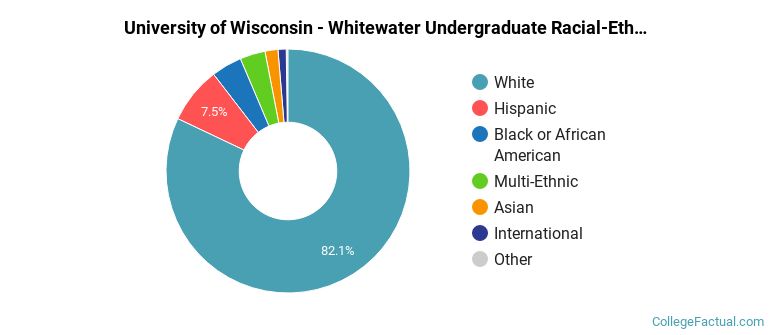
UW - Whitewater Racial-Ethnic Breakdown of Graduate Students

| Race/Ethnicity | Number |
|---|---|
| White | 397 |
| Black or African American | 31 |
| Hispanic | 27 |
| Asian | 18 |
| International | 13 |
| Multi-Ethnic | 13 |
| Native Hawaiian or Pacific Islander | 2 |
| Unknown | 0 |
See racial/ethnic breakdown for all students.
| Race/Ethnicity | Number |
|---|---|
| White | 9,822 |
| Hispanic | 948 |
| Black or African American | 489 |
| Multi-Ethnic | 339 |
| Asian | 242 |
| International | 86 |
| Unknown | 30 |
| Native Hawaiian or Pacific Islander | 8 |
There are approximately 6,027 female students and 5,962 male students at UW - Whitewater.
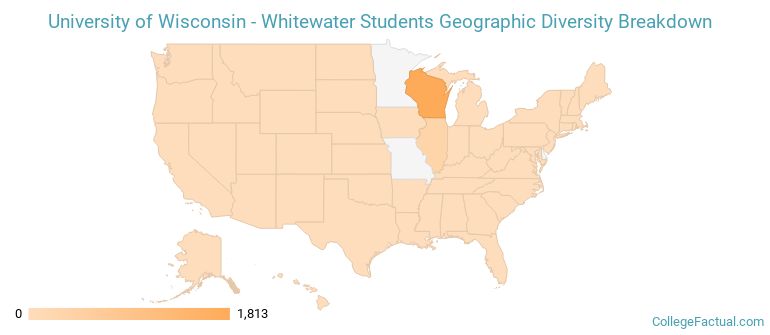
UW - Whitewater ranks 1,271 out of 2,183 when it comes to geographic diversity.
17.52% of UW - Whitewater students come from out of state, and 0.99% come from out of the country.
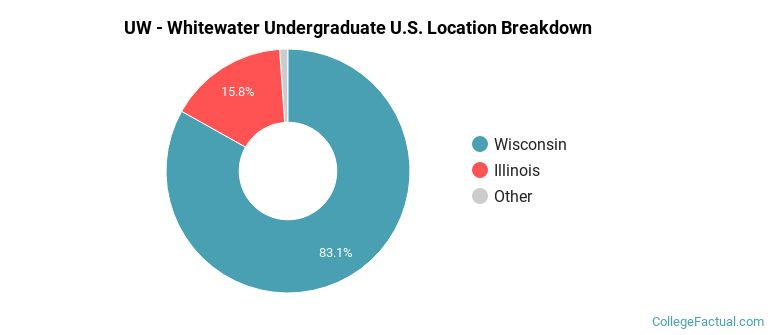
The undergraduate student body is split among 17 states (may include Washington D.C.). Click on the map for more detail.
| State | Amount |
|---|---|
| Wisconsin | 1,813 |
| Illinois | 344 |
| Michigan | 4 |
| California | 3 |
| Indiana | 3 |
Learn more about international students at UW - Whitewater.
A traditional college student is defined as being between the ages of 18-21. At UW - Whitewater, 62.72% of students fall into that category, compared to the national average of 60%.
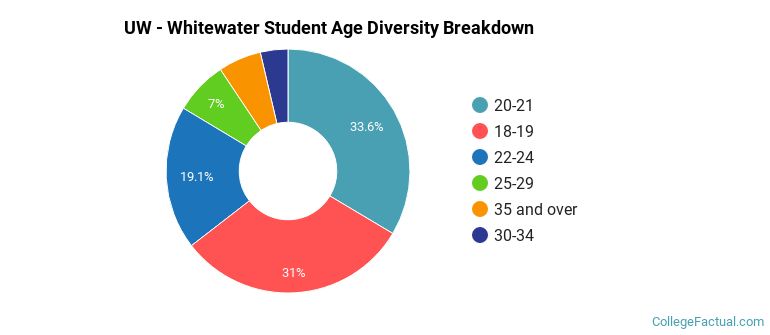
| Student Age Group | Amount |
|---|---|
| 20-21 | 4,056 |
| 18-19 | 3,743 |
| 22-24 | 2,306 |
| 25-29 | 851 |
| 35 and over | 689 |
| 30-34 | 442 |
| Under 18 | 0 |
Footnotes
*The racial-ethnic minorities count is calculated by taking the total number of students and subtracting white students, international students, and students whose race/ethnicity was unknown. This number is then divided by the total number of students at the school to obtain the racial-ethnic minorities percentage.
References