UW total enrollment is approximately 11,829 students. 7,783 are undergraduates and 1,564 are graduate students.
Male/Female Breakdown of Undergraduates
The full-time UW undergraduate population is made up of 51% women, and 49% men.

For the gender breakdown for all students, go here.
UW Racial/Ethnic Breakdown of Undergraduates

| Race/Ethnicity | Number |
|---|---|
| White | 5,985 |
| Unknown | 593 |
| Hispanic | 491 |
| Multi-Ethnic | 312 |
| International | 175 |
| Black or African American | 89 |
| Asian | 84 |
| Native Hawaiian or Pacific Islander | 7 |
See racial/ethnic breakdown for all students.
Male/Female Breakdown of Graduate Students
About 52% of full-time grad students are women, and 48% men.

For the gender breakdown for all students, go here.
UW Racial-Ethnic Breakdown of Graduate Students

| Race/Ethnicity | Number |
|---|---|
| White | 1,010 |
| International | 247 |
| Unknown | 136 |
| Hispanic | 63 |
| Multi-Ethnic | 58 |
| Asian | 26 |
| Black or African American | 10 |
| Native Hawaiian or Pacific Islander | 0 |
See racial/ethnic breakdown for all students.

| Race/Ethnicity | Number |
|---|---|
| White | 8,826 |
| Unknown | 995 |
| Hispanic | 660 |
| International | 509 |
| Multi-Ethnic | 461 |
| Asian | 143 |
| Black or African American | 132 |
| Native Hawaiian or Pacific Islander | 13 |

There are approximately 6,283 female students and 5,546 male students at UW.
UW ranks 302 out of 2,183 when it comes to geographic diversity.
45.18% of UW students come from out of state, and 2.26% come from out of the country.

The undergraduate student body is split among 41 states (may include Washington D.C.). Click on the map for more detail.
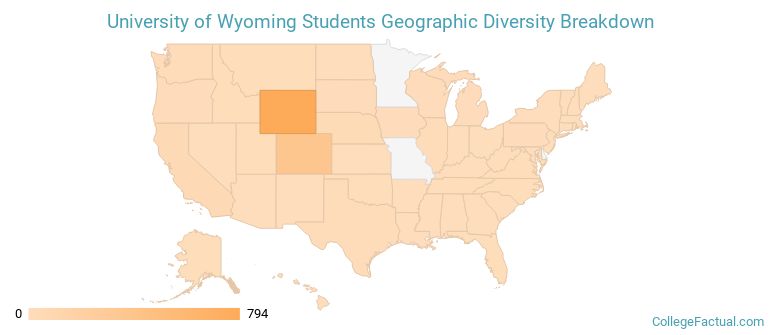
| State | Amount |
|---|---|
| Wyoming | 794 |
| Colorado | 362 |
| California | 59 |
| Nebraska | 38 |
| Texas | 18 |
Students from 95 countries are represented at this school, with the majority of the international students coming from China, India, and Canada.
Learn more about international students at UW.
A traditional college student is defined as being between the ages of 18-21. At UW, 48.56% of students fall into that category, compared to the national average of 60%.

| Student Age Group | Amount |
|---|---|
| 20-21 | 3,261 |
| 18-19 | 2,759 |
| 22-24 | 2,591 |
| 25-29 | 1,675 |
| 35 and over | 1,180 |
| 30-34 | 820 |
| Under 18 | 0 |
Footnotes
*The racial-ethnic minorities count is calculated by taking the total number of students and subtracting white students, international students, and students whose race/ethnicity was unknown. This number is then divided by the total number of students at the school to obtain the racial-ethnic minorities percentage.
References
Department of Homeland Security Citizenship and Immigration Services
Find out how College Factual created their Diversity Rankings.