USU total enrollment is approximately 27,691 students. 17,117 are undergraduates and 1,091 are graduate students.
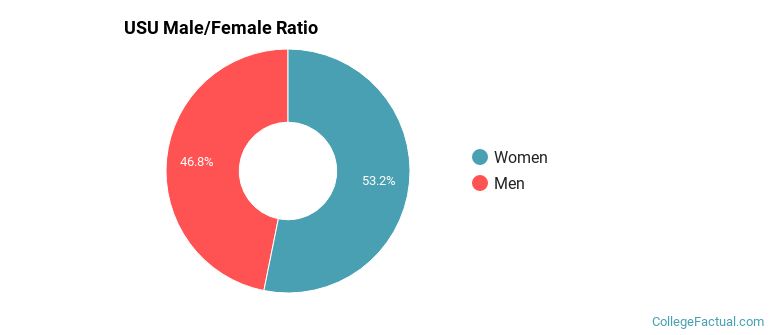
Male/Female Breakdown of Undergraduates
The full-time USU undergraduate population is made up of 53% women, and 47% men.
For the gender breakdown for all students, go here.
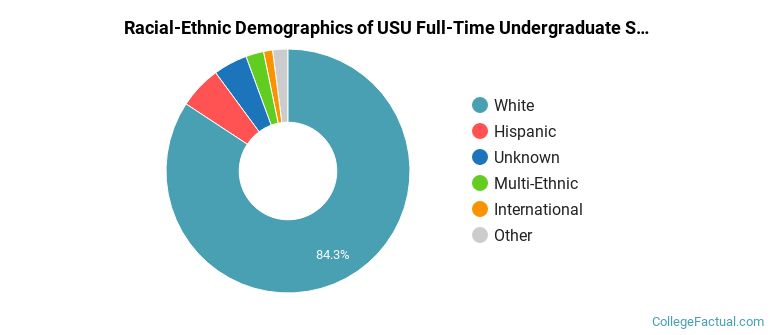
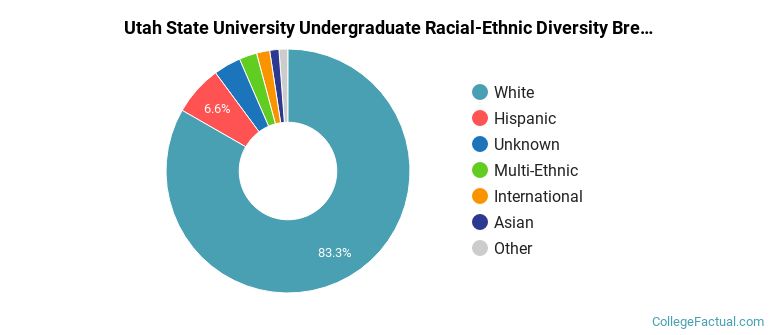
USU Racial/Ethnic Breakdown of Undergraduates
| Race/Ethnicity | Number |
|---|---|
| White | 14,236 |
| Hispanic | 949 |
| Unknown | 808 |
| Multi-Ethnic | 412 |
| Asian | 150 |
| International | 141 |
| Black or African American | 118 |
| Native Hawaiian or Pacific Islander | 49 |
See racial/ethnic breakdown for all students.
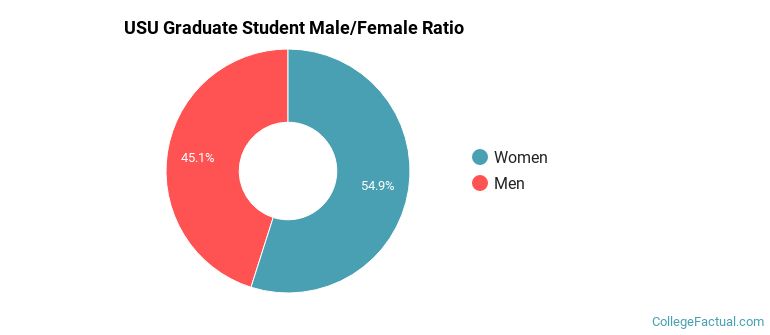
Male/Female Breakdown of Graduate Students
About 53% of full-time grad students are women, and 47% men.
For the gender breakdown for all students, go here.
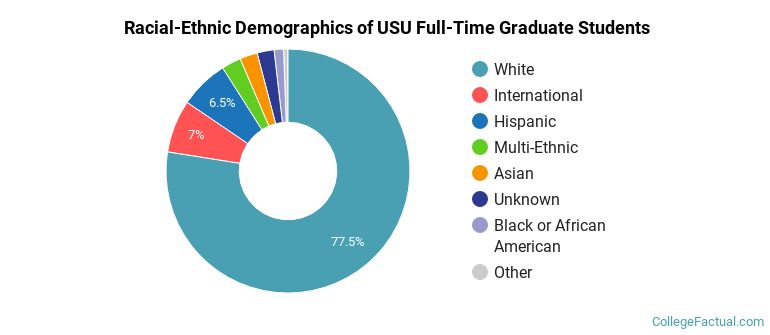
USU Racial-Ethnic Breakdown of Graduate Students
| Race/Ethnicity | Number |
|---|---|
| White | 859 |
| Hispanic | 71 |
| International | 60 |
| Unknown | 32 |
| Multi-Ethnic | 24 |
| Asian | 23 |
| Black or African American | 14 |
| Native Hawaiian or Pacific Islander | 1 |
See racial/ethnic breakdown for all students.
| Race/Ethnicity | Number |
|---|---|
| White | 22,876 |
| Hispanic | 1,720 |
| Unknown | 1,016 |
| Multi-Ethnic | 660 |
| International | 350 |
| Asian | 349 |
| Black or African American | 237 |
| Native Hawaiian or Pacific Islander | 74 |

There are approximately 15,365 female students and 12,326 male students at USU.
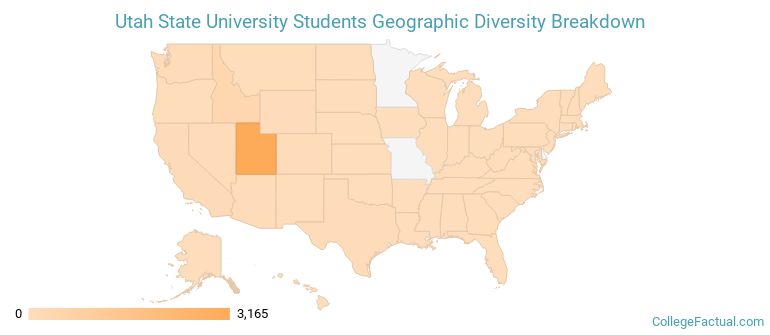
USU ranks 455 out of 2,183 when it comes to geographic diversity.
27.32% of USU students come from out of state, and 1.25% come from out of the country.
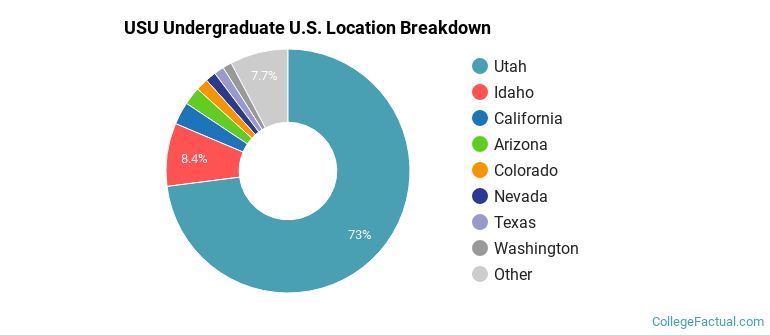
The undergraduate student body is split among 43 states (may include Washington D.C.). Click on the map for more detail.
| State | Amount |
|---|---|
| Utah | 3,165 |
| Idaho | 363 |
| California | 130 |
| Arizona | 103 |
| Colorado | 71 |
Students from 82 countries are represented at this school, with the majority of the international students coming from China, India, and South Korea.
Learn more about international students at USU.
A traditional college student is defined as being between the ages of 18-21. At USU, 41.89% of students fall into that category, compared to the national average of 60%.
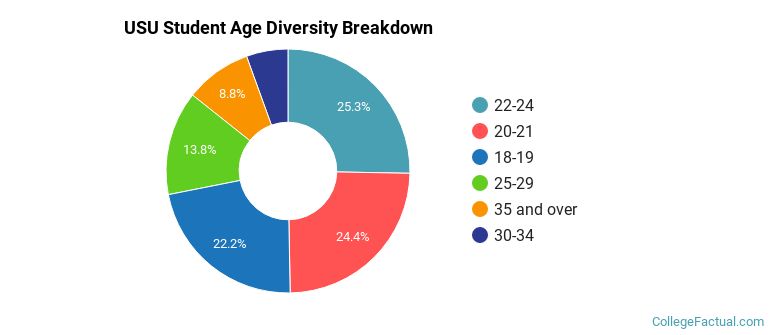
| Student Age Group | Amount |
|---|---|
| 22-24 | 6,296 |
| 20-21 | 6,075 |
| 18-19 | 5,519 |
| 25-29 | 3,434 |
| 35 and over | 2,186 |
| 30-34 | 1,374 |
| Under 18 | 0 |
Footnotes
*The racial-ethnic minorities count is calculated by taking the total number of students and subtracting white students, international students, and students whose race/ethnicity was unknown. This number is then divided by the total number of students at the school to obtain the racial-ethnic minorities percentage.
References
Department of Homeland Security Citizenship and Immigration Services
Image Credit: By Cory Maylett under License
Find out how College Factual created their Diversity Rankings.