Valpo total enrollment is approximately 3,122 students. 2,678 are undergraduates and 252 are graduate students.
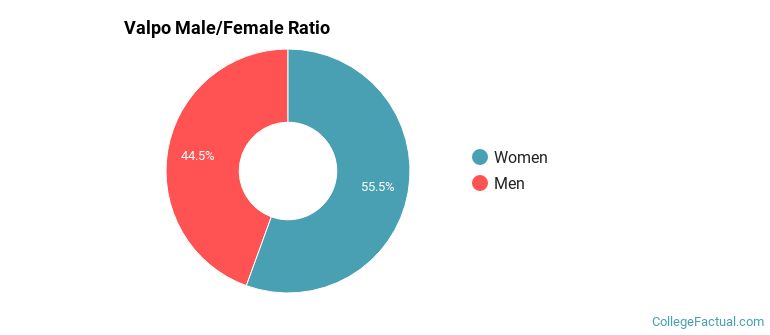
Male/Female Breakdown of Undergraduates
The full-time Valpo undergraduate population is made up of 56% women, and 44% men.
For the gender breakdown for all students, go here.
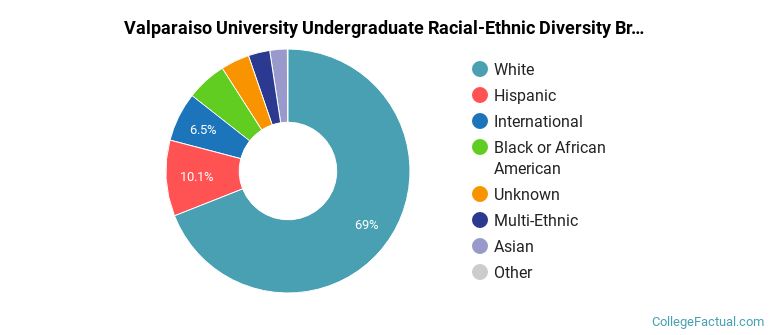
Valpo Racial/Ethnic Breakdown of Undergraduates

| Race/Ethnicity | Number |
|---|---|
| White | 1,934 |
| Hispanic | 308 |
| Black or African American | 161 |
| Multi-Ethnic | 89 |
| Unknown | 65 |
| Asian | 63 |
| International | 54 |
| Native Hawaiian or Pacific Islander | 0 |
See racial/ethnic breakdown for all students.
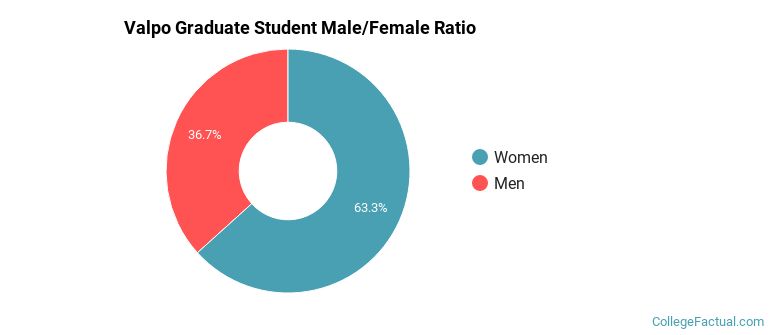
Male/Female Breakdown of Graduate Students
About 67% of full-time grad students are women, and 33% men.
For the gender breakdown for all students, go here.
Valpo Racial-Ethnic Breakdown of Graduate Students

| Race/Ethnicity | Number |
|---|---|
| White | 151 |
| International | 64 |
| Hispanic | 13 |
| Unknown | 10 |
| Black or African American | 7 |
| Multi-Ethnic | 5 |
| Asian | 2 |
| Native Hawaiian or Pacific Islander | 0 |
See racial/ethnic breakdown for all students.
| Race/Ethnicity | Number |
|---|---|
| White | 2,203 |
| Hispanic | 339 |
| Black or African American | 175 |
| International | 132 |
| Unknown | 98 |
| Multi-Ethnic | 96 |
| Asian | 75 |
| Native Hawaiian or Pacific Islander | 0 |

There are approximately 1,795 female students and 1,327 male students at Valpo.
Valpo ranks 426 out of 2,183 when it comes to geographic diversity.
56.67% of Valpo students come from out of state, and 1.74% come from out of the country.
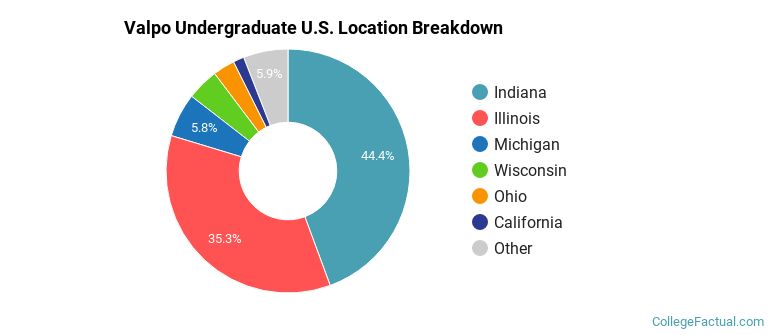
The undergraduate student body is split among 30 states (may include Washington D.C.). Click on the map for more detail.
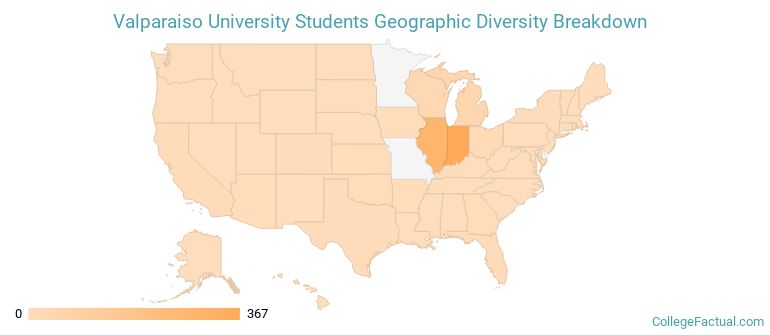
| State | Amount |
|---|---|
| Indiana | 367 |
| Illinois | 292 |
| Michigan | 48 |
| Wisconsin | 35 |
| Ohio | 24 |
Students from 49 countries are represented at this school, with the majority of the international students coming from India, China, and Saudi Arabia.
Learn more about international students at Valpo.
A traditional college student is defined as being between the ages of 18-21. At Valpo, 67.86% of students fall into that category, compared to the national average of 60%.
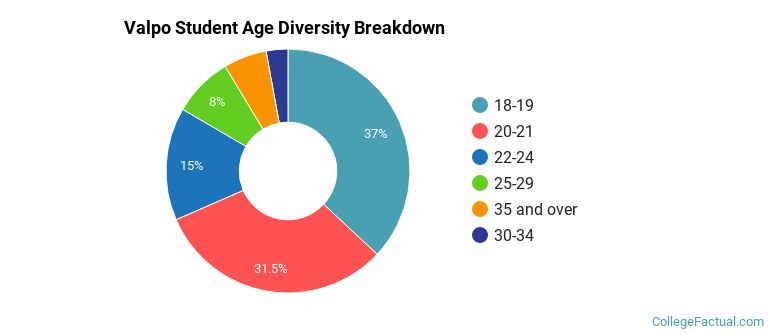
| Student Age Group | Amount |
|---|---|
| 18-19 | 1,475 |
| 20-21 | 1,257 |
| 22-24 | 597 |
| 25-29 | 318 |
| 35 and over | 229 |
| 30-34 | 115 |
| Under 18 | 0 |
Footnotes
*The racial-ethnic minorities count is calculated by taking the total number of students and subtracting white students, international students, and students whose race/ethnicity was unknown. This number is then divided by the total number of students at the school to obtain the racial-ethnic minorities percentage.
References
Department of Homeland Security Citizenship and Immigration Services
Image Credit: By Runner1928 under License
Learn more about how College Factual creates their Diversity Rankings.