 by our College Data Analytics Team
Explore the best ranked schools for the programs you are most interested in.
Vanguard Adult Career Center was not ranked in College Factual's 2025 Best Overall Colleges report. This could be for a number of reasons, including lack of data.
See all of the rankings for Vanguard-Sentinel Adult Career and Technology Center.
If you are worried about getting into Vanguard-Sentinel Adult Career and Technology Center, don't be. The school has a liberal open admissions policy, which means you only need to meet basic requirements in order to be admitted. Still, be sure to submit a complete application and provide any other requested materials.
At Vanguard Adult Career Center, the student to faculty ratio is an excellent 5 to 1. That's much better than the national average of 15 to 1. This indicates that many classes will probably be small, and students will have ample opportunites to work closely with their professors and classmates.
The freshmen retention rate is a sign of how many full-time students like a college or university well enough to come back for their sophomore year. At Vanguard-Sentinel Adult Career and Technology Center this rate is 50%, which is a bit lower than the national average of 68%.
During the 2017-2018 academic year, there were 23 full-time undergraduates at Vanguard Adult Career Center.
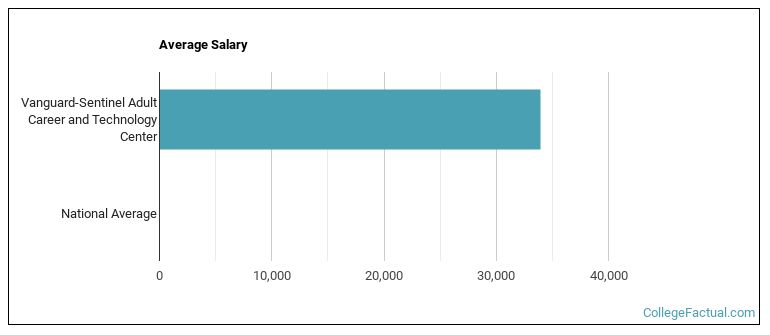
See which majors at Vanguard-Sentinel Adult Career and Technology Center make the most money.
Get more details about the location of Vanguard-Sentinel Adult Career and Technology Center.

Contact details for Vanguard Adult Career Center are given below.
| Contact Details | |
|---|---|
| Address: | 1306 Cedar St, Fremont, OH 43420 |
| Phone: | 567-201-2856 |
| Website: | https://www.vscc.k12.oh.us/adult-ed/ |
| Most Popular Majors | Bachelor’s Degrees | Average Salary of Graduates |
|---|---|---|
| Allied Health Professions | 10 | NA |
| Precision Metal Working | 10 | NA |
| Clinical/Medical Laboratory Science | 6 | NA |
| Business Support & Assistant Services | 2 | NA |
| Other Health Professions | 1 | NA |
| Health & Medical Administrative Services | 0 | NA |
Footnotes
*The racial-ethnic minorities count is calculated by taking the total number of students and subtracting white students, international students, and students whose race/ethnicity was unknown. This number is then divided by the total number of students at the school to obtain the racial-ethnic minorities percentage.
References
More about our data sources and methodologies.