In its yearly rankings, College Factual analyzes over 2,000 colleges and universities to determine which ones are the best in a variety of categories, such as overall value, quality, diversity, which schools are the best for each major, and much more.
Victor Valley College was awarded 18 badges in the 2025 rankings. The highest ranked major at the school is biological & physical science.
Explore the best ranked schools for the programs you are most interested in.
According to College Factual's 2025 analysis, Victor Valley College is ranked #870 out of 2,152 schools in the nation that were analyzed for overall quality. This is an improvement over the previous year, when Victor Valley College held the #1,482 spot on the Best Overall Colleges list.
Out of the 161 colleges in California, Victor Valley College is ranked at #103.
Returning adults and other non-traditional students may appreciate the fact that Victor Valley College has an open admissions policy. This means that you'll only have to submit basic materials, which may include proof that you completed high school or an equivalent program.
The student to faculty ratio is often used as a measure to gauge how much access students will have to their professors - the lower the number, the better. At Victor Valley College, this rate is 28 to 1, which is high when compared to the national average of 15 to 1.
When estimating how much access students will have to their teachers, some people like to look at what percentage of faculty members are full time. This is because part-time teachers may not have as much time to spend on campus as their full-time counterparts.
The full-time faculty percentage at Victor Valley College is 18%. This is lower than the national average of 47%.
The freshmen retention rate tells us what percentage of first-year, full-time students choose to continue on to their sophomore year at a particular school. The rate at Victor Valley College is 71%, which is about average when compared to the national rate of 68%.
During the 2017-2018 academic year, there were 10,777 undergraduates at Victor Valley College with 3,139 being full-time and 7,638 being part-time.
| $0-30 K | $30K-48K | $48-75 | $75-110K | $110K + |
|---|---|---|---|---|
| $11,618 | $12,113 | $14,082 | $15,408 | $14,258 |
The net price is calculated by adding tuition, room, board and other costs and subtracting financial aid.Note that the net price is typically less than the published for a school. For more information on the sticker price of Victor Valley College, see our tuition and fees and room and board pages.
The student loan default rate at Victor Valley College is 6.0%. This is significantly lower than the national default rate of 10.1%, which is a good sign that you'll be able to pay back your student loans.
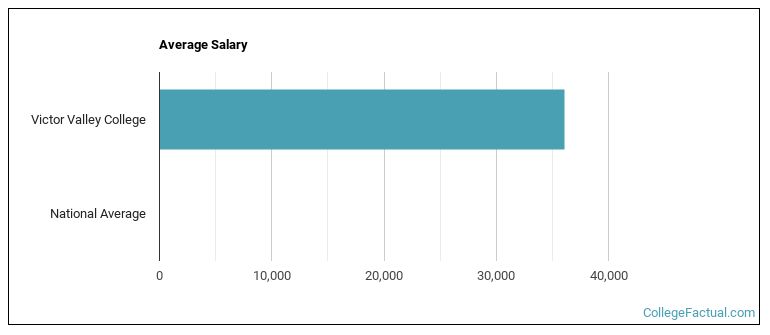
See which majors at Victor Valley College make the most money.
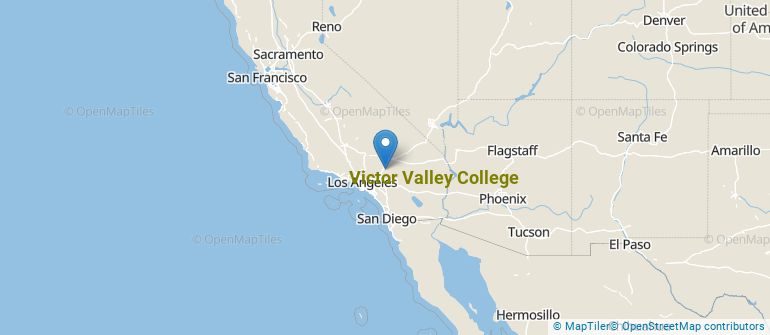
Get more details about the location of Victor Valley College.
Contact details for Victor Valley College are given below.
| Contact Details | |
|---|---|
| Address: | 18422 Bear Valley Rd, Victorville, CA 92395-5850 |
| Phone: | 760-245-4271 |
| Website: | www.vvc.edu/ |
| Most Popular Majors | Bachelor’s Degrees | Average Salary of Graduates |
|---|---|---|
| Liberal Arts General Studies | 1,715 | NA |
| Allied Health Professions | 927 | NA |
| Fire Protection | 421 | NA |
| Biological & Physical Science | 411 | NA |
| Human Development & Family Studies | 282 | NA |
| Vehicle Maintenance & Repair | 183 | NA |
| Nursing | 155 | NA |
| General Psychology | 125 | NA |
| General Business/Commerce | 107 | NA |
| Criminal Justice & Corrections | 91 | NA |
Online courses area a great option for busy, working students as well as for those who have scheduling conflicts and want to study on their own time. As time goes by, expect to see more and more online learning options become available.
In 2022-2023, 7,373 students took at least one online class at Victor Valley College. This is an increase from the 4,887 students who took online classes the previous year.
| Year | Took at Least One Online Class | Took All Classes Online |
|---|---|---|
| 2022-2023 | 7,373 | 3,508 |
| 2021-2022 | 4,887 | 2,333 |
| 2020-2021 | 4,776 | 1,500 |
| 2018-2019 | 3,959 | 1,342 |
Footnotes
*The racial-ethnic minorities count is calculated by taking the total number of students and subtracting white students, international students, and students whose race/ethnicity was unknown. This number is then divided by the total number of students at the school to obtain the racial-ethnic minorities percentage.
References
More about our data sources and methodologies.