Explore the best ranked schools for the programs you are most interested in.
Villa was not ranked in College Factual's Best Overall Colleges report this year. This may be because not enough data was available.
The acceptance rate at Villa Maria College is 78%. That's higher than the rate at many schools, but still low enough to be considered somewhat selective. If you want to get in, you'll need good grades and to be able to show that Villa is a good fit for you.
About 6% of students accepted to Villa submitted their SAT scores. When looking at the 25th through the 75th percentile, SAT Evidence-Based Reading and Writing scores ranged between 390 and 520. Math scores were between 340 and 530.
The student to faculty ratio at Villa is an impressive 8 to 1. That's quite good when you compare it to the national average of 15 to 1. This is a good sign that students at the school will have more opportunities for one-on-one interactions with their professors.
In addition to the student to faculty ratio, some people look at what percentage of faculty members are full-time as a sign of how much time professors will be able to spend with their students. This is because part-time teachers may not be be on campus as much as their full-time counterparts.
The full-time faculty percentage at Villa Maria College is 42%. This is lower than the national average of 47%.
The freshmen retention rate is a sign of how many full-time students like a college or university well enough to come back for their sophomore year. At Villa Maria College this rate is 62%, which is a bit lower than the national average of 68%.
The on-time graduation rate is the percent of first-time, full time students who obtain their bachelor's degree in four years or less. This rate is 23% for first-time, full-time students at Villa, which is lower than the national rate of 33.3%.
Find out more about the retention and graduation rates at Villa Maria College.
During the 2017-2018 academic year, there were 508 undergraduates at Villa with 431 being full-time and 77 being part-time.
| $0-30 K | $30K-48K | $48-75 | $75-110K | $110K + |
|---|---|---|---|---|
| $12,280 | $12,486 | $9,085 | $16,476 | $17,550 |
The net price is calculated by adding tuition, room, board and other costs and subtracting financial aid.Note that the net price is typically less than the published for a school. For more information on the sticker price of Villa, see our tuition and fees and room and board pages.
Almost 66% of college students who graduated with the class of 2018 took out student loans, but that percentage varies from school to school. At Villa, approximately 41% of students took out student loans averaging $6,026 a year. That adds up to $24,104 over four years for those students.
The student loan default rate at Villa is 1.0%. This is significantly lower than the national default rate of 10.1%, which is a good sign that you'll be able to pay back your student loans.
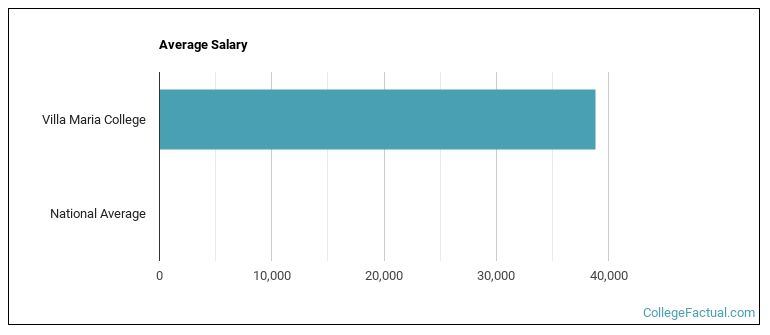
See which majors at Villa Maria College make the most money.
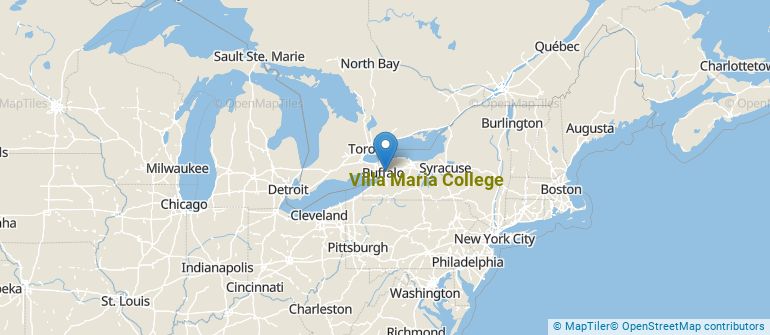
Get more details about the location of Villa Maria College.
Contact details for Villa are given below.
| Contact Details | |
|---|---|
| Address: | 240 Pine Ridge Rd, Buffalo, NY 14225-3999 |
| Phone: | 716-896-0700 |
| Website: | https://www.villa.edu/ |
| Most Popular Majors | Bachelor’s Degrees | Average Salary of Graduates |
|---|---|---|
| Design & Applied Arts | 26 | NA |
| Graphic Communications | 21 | NA |
| Allied Health & Medical Assisting Services | 15 | NA |
| Film, Video & Photographic Arts | 8 | NA |
| Business Administration & Management | 7 | NA |
| Arts & Media Management | 5 | NA |
| Liberal Arts General Studies | 3 | NA |
| Fine & Studio Arts | 3 | NA |
| General Psychology | 2 | NA |
| Radio, Television & Digital Communication | 0 | NA |
Online learning options are becoming more and more popular at American colleges and universities. Online classes are great for students who have busy schedules or for those who just want to study on their own time.
In 2022-2023, 158 students took at least one online class at Villa Maria College. This is an increase from the 127 students who took online classes the previous year.
| Year | Took at Least One Online Class | Took All Classes Online |
|---|---|---|
| 2022-2023 | 158 | 3 |
| 2021-2022 | 127 | 1 |
| 2020-2021 | 244 | 9 |
| 2018-2019 | 50 | 0 |
Footnotes
*The racial-ethnic minorities count is calculated by taking the total number of students and subtracting white students, international students, and students whose race/ethnicity was unknown. This number is then divided by the total number of students at the school to obtain the racial-ethnic minorities percentage.
References
More about our data sources and methodologies.