We've pulled together some essential information you should know about the program, including how many students graduate each year, the ethnic diversity of these students, and more. We've also included details on how Villanova ranks compared to other colleges offering a major in compsci.
Go directly to any of the following sections:
Villanova was ranked #51 on College Factual's most recent list of the best schools for compsci majors. This puts the bachelor's program at the school solidly in the top 15% of all colleges and universities in the country. It is also ranked #4 in Pennsylvania.
| Ranking Type | Rank |
|---|---|
| Best Computer Science Graduate Degree Schools | 34 |
| Best Computer Science Master’s Degree Schools | 34 |
| Best Computer Science Schools | 51 |
| Best Computer Science Bachelor’s Degree Schools | 58 |
During the 2021-2022 academic year, Villanova University handed out 46 bachelor's degrees in computer science. This is a decrease of 10% over the previous year when 51 degrees were handed out.
In 2022, 40 students received their master’s degree in compsci from Villanova. This makes it the #81 most popular school for compsci master’s degree candidates in the country.
Part-time undergraduates at Villanova paid an average of $1,010 per credit hour in 2022-2023. This tuition was the same for both in-state and out-of-state students. Information about average full-time undergraduate tuition and fees is shown in the table below.
| In State | Out of State | |
|---|---|---|
| Tuition | $63,806 | $63,806 |
| Fees | $895 | $895 |
| Books and Supplies | $1,100 | $1,100 |
| On Campus Room and Board | $16,896 | $16,896 |
| On Campus Other Expenses | $2,300 | $2,300 |
Learn more about Villanova tuition and fees.
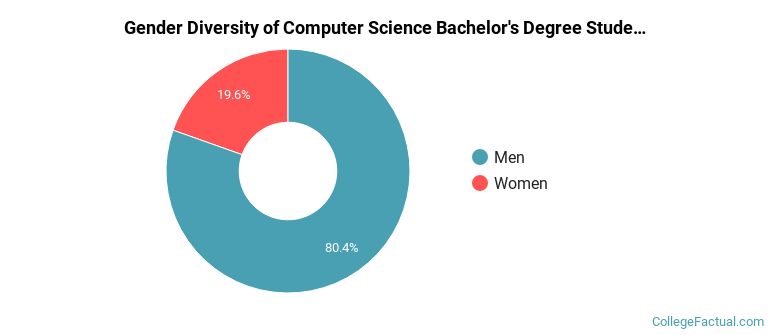
Of the 46 students who earned a bachelor's degree in Computer Science from Villanova in 2021-2022, 80% were men and 20% were women.
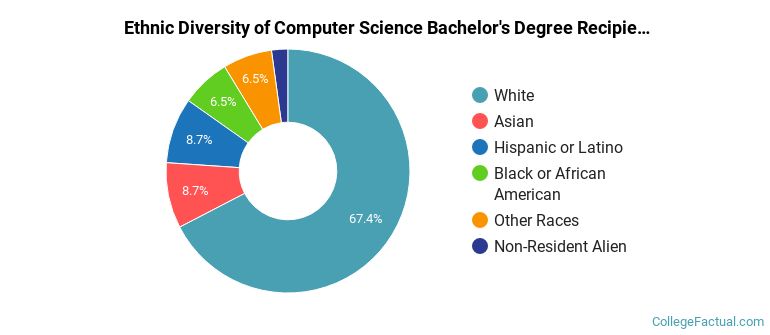
The majority of the students with this major are white. About 67% of 2022 graduates were in this category.
The following table and chart show the ethnic background for students who recently graduated from Villanova University with a bachelor's in compsci.
| Ethnic Background | Number of Students |
|---|---|
| Asian | 4 |
| Black or African American | 3 |
| Hispanic or Latino | 4 |
| White | 31 |
| Non-Resident Aliens | 1 |
| Other Races | 3 |
Online degrees for the Villanova compsci bachelor’s degree program are not available at this time. To see if the school offers distance learning options in other areas, visit the Villanova Online Learning page.
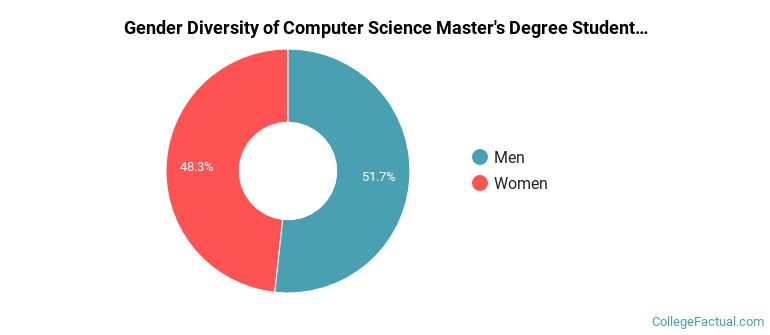
During the 2021-2022 academic year, 29 students graduated with a master's degree in compsci from Villanova. About 52% were men and 48% were women.
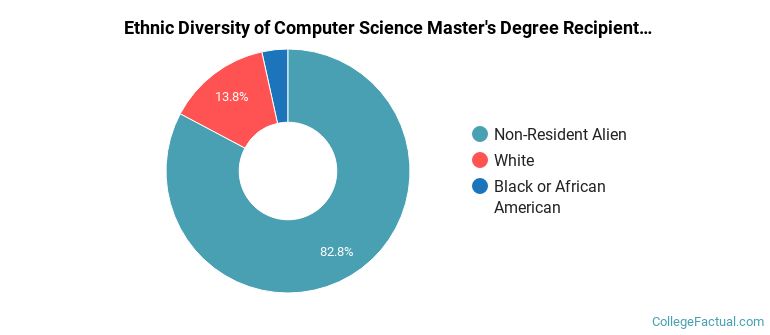
The following table and chart show the ethnic background for students who recently graduated from Villanova University with a master's in compsci.
| Ethnic Background | Number of Students |
|---|---|
| Asian | 0 |
| Black or African American | 1 |
| Hispanic or Latino | 0 |
| White | 4 |
| Non-Resident Aliens | 24 |
| Other Races | 0 |
Take a look at the following statistics related to the make-up of the compsci majors at Villanova University.
| Related Major | Annual Graduates |
|---|---|
| Computer Information Systems | 31 |
View All Computer Science Related Majors >
More about our data sources and methodologies.