VCU total enrollment is approximately 29,070 students. 18,734 are undergraduates and 4,962 are graduate students.
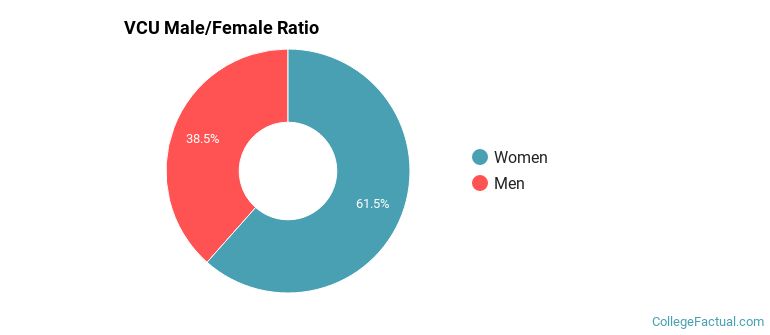
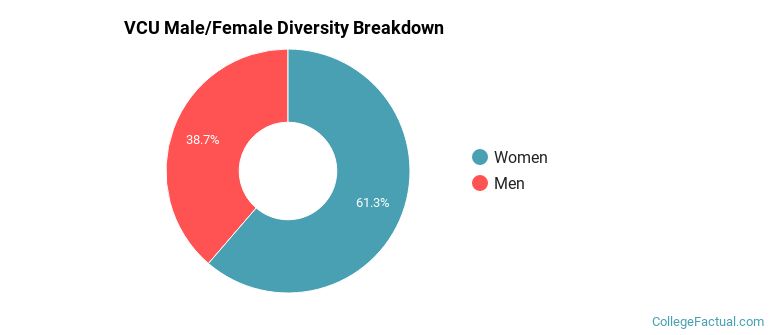
Male/Female Breakdown of Undergraduates
The full-time VCU undergraduate population is made up of 63% women, and 37% men.
For the gender breakdown for all students, go here.
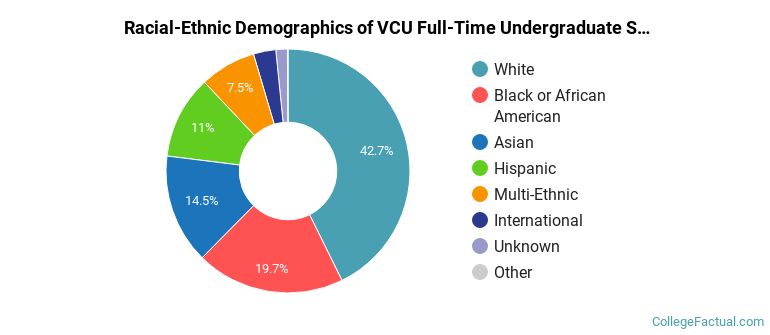
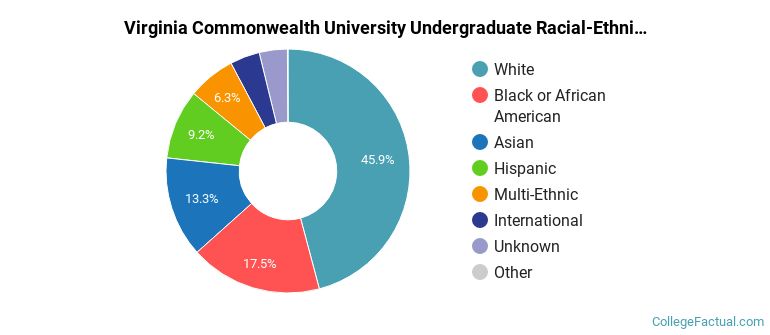
VCU Racial/Ethnic Breakdown of Undergraduates
| Race/Ethnicity | Number |
|---|---|
| White | 7,754 |
| Black or African American | 3,759 |
| Asian | 2,831 |
| Hispanic | 2,122 |
| Multi-Ethnic | 1,479 |
| International | 435 |
| Unknown | 313 |
| Native Hawaiian or Pacific Islander | 13 |
See racial/ethnic breakdown for all students.
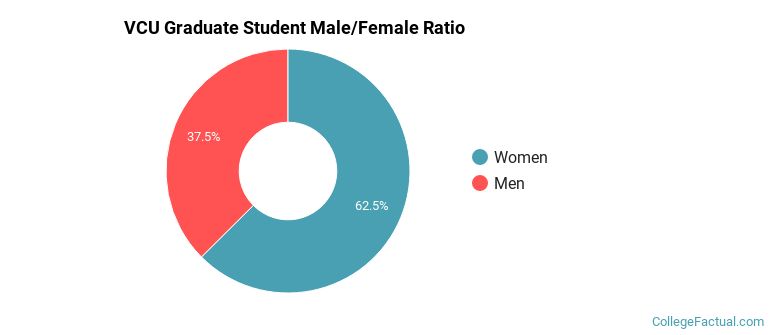
Male/Female Breakdown of Graduate Students
About 63% of full-time grad students are women, and 37% men.
For the gender breakdown for all students, go here.
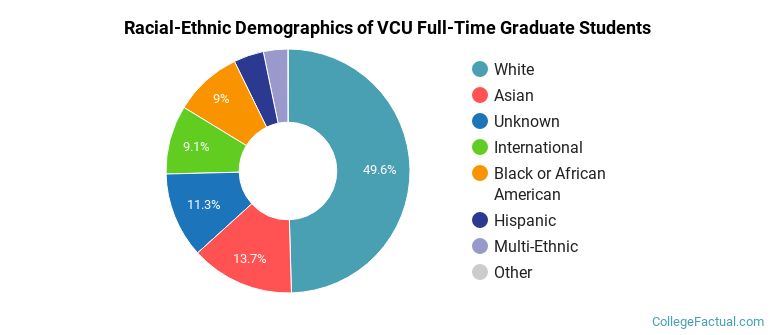
VCU Racial-Ethnic Breakdown of Graduate Students
| Race/Ethnicity | Number |
|---|---|
| White | 2,451 |
| Asian | 670 |
| Black or African American | 531 |
| Unknown | 521 |
| International | 372 |
| Hispanic | 253 |
| Multi-Ethnic | 158 |
| Native Hawaiian or Pacific Islander | 1 |
See racial/ethnic breakdown for all students.
| Race/Ethnicity | Number |
|---|---|
| White | 13,090 |
| Black or African American | 5,256 |
| Asian | 3,954 |
| Hispanic | 2,758 |
| Multi-Ethnic | 1,905 |
| Unknown | 1,067 |
| International | 982 |
| Native Hawaiian or Pacific Islander | 18 |
There are approximately 18,197 female students and 10,873 male students at VCU.
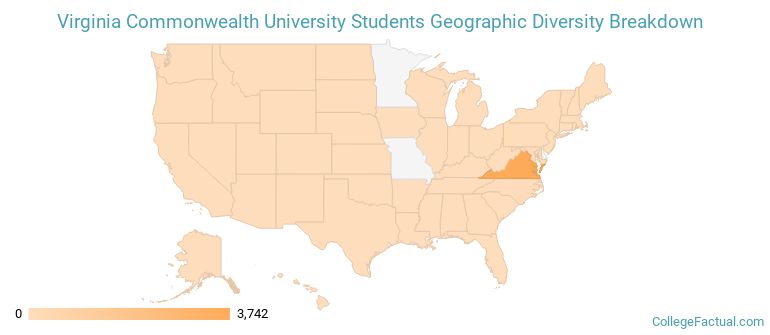
VCU ranks 1,166 out of 2,183 when it comes to geographic diversity.
7.32% of VCU students come from out of state, and 2.17% come from out of the country.
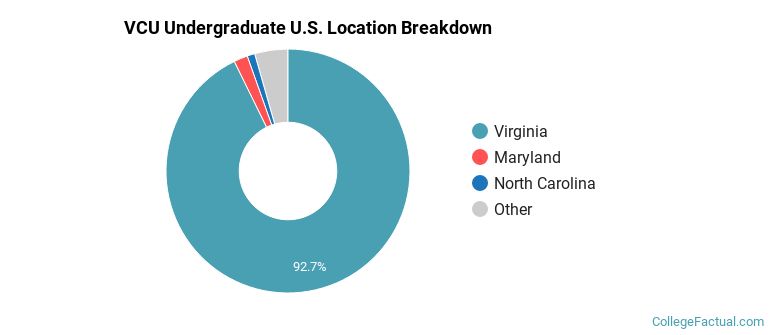
The undergraduate student body is split among 30 states (may include Washington D.C.). Click on the map for more detail.
| State | Amount |
|---|---|
| Virginia | 3,742 |
| Maryland | 74 |
| North Carolina | 41 |
| Pennsylvania | 29 |
| New Jersey | 21 |
Students from 103 countries are represented at this school, with the majority of the international students coming from Saudi Arabia, India, and China.
Learn more about international students at VCU.
A traditional college student is defined as being between the ages of 18-21. At VCU, 50.51% of students fall into that category, compared to the national average of 60%.
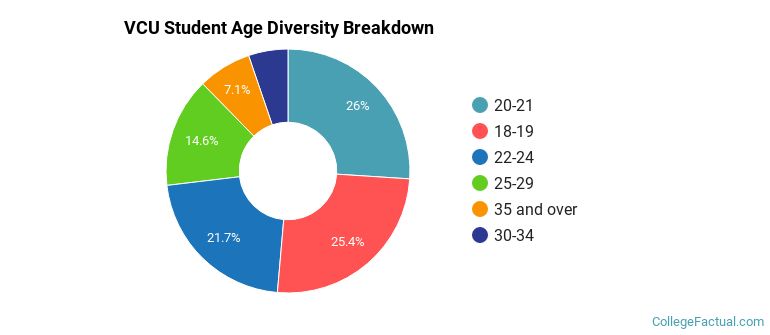
| Student Age Group | Amount |
|---|---|
| 20-21 | 7,849 |
| 18-19 | 7,645 |
| 22-24 | 6,551 |
| 25-29 | 4,390 |
| 35 and over | 2,139 |
| 30-34 | 1,579 |
| Under 18 | 0 |
Footnotes
*The racial-ethnic minorities count is calculated by taking the total number of students and subtracting white students, international students, and students whose race/ethnicity was unknown. This number is then divided by the total number of students at the school to obtain the racial-ethnic minorities percentage.
References
Department of Homeland Security Citizenship and Immigration Services
Image Credit: By user:mentes under License
Find out how College Factual created their Diversity Rankings.