Explore the best ranked schools for the programs you are most interested in.
Virginia University of Lynchburg was not ranked in College Factual's 2025 Best Overall Colleges report. This could be for a number of reasons, including lack of data.
See all of the rankings for Virginia University of Lynchburg.
As long as you meet basic requirements, you should not have any trouble getting into Virginia University of Lynchburg since the school has an open admissions policy. Still, be sure to submit any requested materials and that your application is completed in full.
With a student to faculty ratio of 14 to 1, Virginia University of Lynchburg is about average in this regard as the nationwide rate is 15 to 1. While this does not translate directly to class size, it's a good indicator of how much time professors will have to spend with their students on a one-on-one basis.
In addition to the student to faculty ratio, some people look at what percentage of faculty members are full-time as a sign of how much time professors will be able to spend with their students. This is because part-time teachers may not be be on campus as much as their full-time counterparts.
The full-time faculty percentage at Virginia University of Lynchburg is 25%. This is lower than the national average of 47%.
Virginia University of Lynchburg has a freshmen retention rate of 75%. That's a good sign that full-time students like the school and their professors enough to want to stick around for another year. It's also a sign that the admissions team did a good job in choosing applicants who were a good fit for the school.
The on-time graduation rate is the percent of first-time, full time students who obtain their bachelor's degree in four years or less. This rate is 16% for first-time, full-time students at Virginia University of Lynchburg, which is lower than the national rate of 33.3%.
Find out more about the retention and graduation rates at Virginia University of Lynchburg.
During the 2017-2018 academic year, there were 122 undergraduates at Virginia University of Lynchburg with 100 being full-time and 22 being part-time.
| $0-30 K | $30K-48K | $48-75 | $75-110K | $110K + |
|---|---|---|---|---|
| $18,426 | $16,303 | $17,702 | $19,613 | $20,627 |
The net price is calculated by adding tuition, room, board and other costs and subtracting financial aid.Note that the net price is typically less than the published for a school. For more information on the sticker price of Virginia University of Lynchburg, see our tuition and fees and room and board pages.
Almost 66% of college students who graduated with the class of 2018 took out student loans, but that percentage varies from school to school. At Virginia University of Lynchburg, approximately 79% of students took out student loans averaging $6,153 a year. That adds up to $24,612 over four years for those students.
Get more details about paying for Virginia University of Lynchburg.
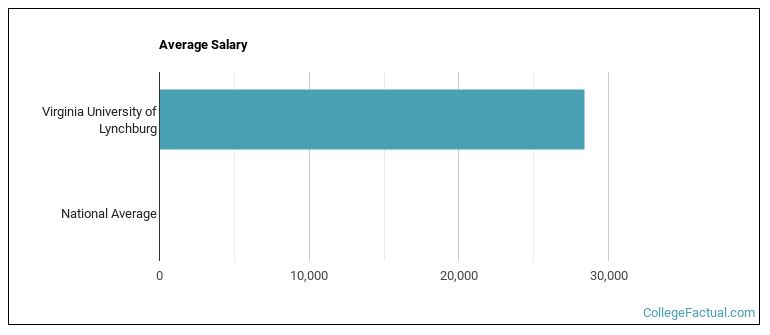
See which majors at Virginia University of Lynchburg make the most money.
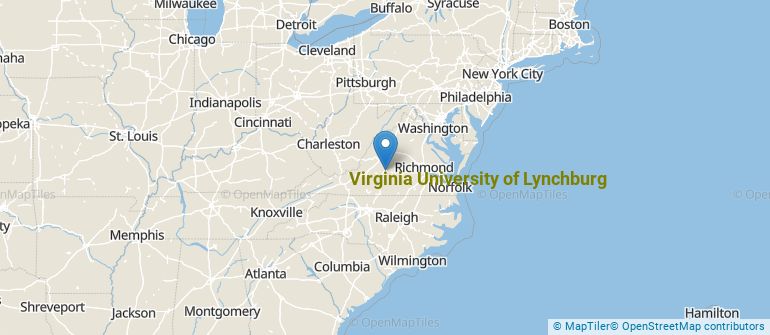
Get more details about the location of Virginia University of Lynchburg.
Contact details for Virginia University of Lynchburg are given below.
| Contact Details | |
|---|---|
| Address: | 2058 Garfield Ave, Lynchburg, VA 24501 |
| Phone: | 434-528-5276 |
| Website: | www.vul.edu/ |
| Most Popular Majors | Bachelor’s Degrees | Average Salary of Graduates |
|---|---|---|
| Business Administration & Management | 284 | NA |
| Human Resource Management | 9 | NA |
| General Business/Commerce | 4 | NA |
| Sociology | 3 | NA |
| Other Multi/Interdisciplinary Studies | 2 | NA |
| Religious Studies | 2 | NA |
| Other Business, Management & Marketing | 0 | NA |
| Liberal Arts General Studies | 0 | NA |
| Health & Physical Education | 0 | NA |
| Other Philosophy & Religious Studies | 0 | NA |
Online learning options are becoming more and more popular at American colleges and universities. Online classes are great for students who have busy schedules or for those who just want to study on their own time.
In 2022-2023, 248 students took at least one online class at Virginia University of Lynchburg. This is a decrease from the 558 students who took online classes the previous year.
| Year | Took at Least One Online Class | Took All Classes Online |
|---|---|---|
| 2022-2023 | 248 | 248 |
| 2021-2022 | 558 | 558 |
| 2020-2021 | 227 | 227 |
| 2018-2019 | 74 | 27 |
Learn more about online learning at Virginia University of Lynchburg.
Footnotes
*The racial-ethnic minorities count is calculated by taking the total number of students and subtracting white students, international students, and students whose race/ethnicity was unknown. This number is then divided by the total number of students at the school to obtain the racial-ethnic minorities percentage.
References
More about our data sources and methodologies.