Explore the best ranked schools for the programs you are most interested in.
Visible Music College was not ranked in College Factual's 2025 Best Overall Colleges report. This could be for a number of reasons, including lack of data.
With an acceptance rate of 20%, Visible Music College is one of the most selective schools in the country. Good grades and high test scores alone may not be enough to get you into the school, so do your best to submit a stellar application.
About 14% of students accepted to Visible Music College submitted their SAT scores.Visible Music College received ACT scores from 16% of accepted students. When looking at the 25th through the 75th percentile, ACT Composite scores ranged between 17 and 30.
The student to faculty ratio is often used to measure the number of teaching resources that a college or university offers its students. The national average for this metric is 15 to 1, but at Visible Music College it is much better at 6 to 1. That's good news for students who want to interact more on a personal level with their teachers.
In addition to the student to faculty ratio, some people look at what percentage of faculty members are full-time as a sign of how much time professors will be able to spend with their students. This is because part-time teachers may not be be on campus as much as their full-time counterparts.
The full-time faculty percentage at Visible Music College is 50%. This is comparable to the national average of 47%.
Visible Music College has a freshmen retention rate of 83%. That's a good sign that full-time students like the school and their professors enough to want to stick around for another year. It's also a sign that the admissions team did a good job in choosing applicants who were a good fit for the school.
The on-time graduation rate is the percent of first-time, full time students who obtain their bachelor's degree in four years or less. This rate is 11% for first-time, full-time students at Visible Music College, which is lower than the national rate of 33.3%.
Find out more about the retention and graduation rates at Visible Music College.
During the 2017-2018 academic year, there were 200 undergraduates at Visible Music College with 97 being full-time and 103 being part-time.
| $0-30 K | $30K-48K | $48-75 | $75-110K | $110K + |
|---|---|---|---|---|
| $23,485 | $23,028 | $31,386 | $22,925 | $28,011 |
The net price is calculated by adding tuition, room, board and other costs and subtracting financial aid.Note that the net price is typically less than the published for a school. For more information on the sticker price of Visible Music College, see our tuition and fees and room and board pages.
Almost 66% of college students who graduated with the class of 2018 took out student loans, but that percentage varies from school to school. At Visible Music College, approximately 66% of students took out student loans averaging $8,869 a year. That adds up to $35,476 over four years for those students.
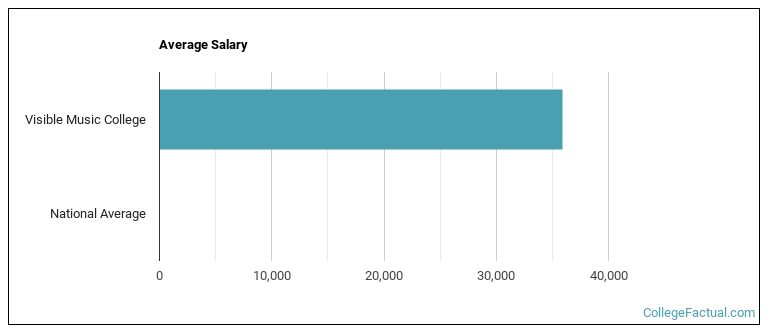
See which majors at Visible Music College make the most money.
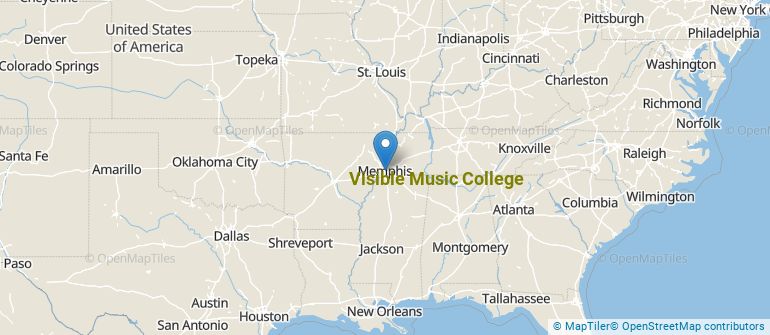
Get more details about the location of Visible Music College.
Contact details for Visible Music College are given below.
| Contact Details | |
|---|---|
| Address: | 200 Madison Ave, Memphis, TN 38103 |
| Phone: | 901-381-3939 |
| Website: | www.visible.edu/ |
| Most Popular Majors | Bachelor’s Degrees | Average Salary of Graduates |
|---|---|---|
| Music | 32 | $25,929 |
| Pastoral Counseling & Specialized Ministries | 25 | NA |
| Computer Software & Applications | 22 | NA |
| Drama & Theater Arts | 14 | NA |
| Dance | 6 | NA |
| Audiovisual Communications | 5 | NA |
| Business Administration & Management | 4 | NA |
| Arts & Media Management | 2 | NA |
| Radio, Television & Digital Communication | 1 | NA |
| Sacred Music | 1 | NA |
Online learning options are becoming more and more popular at American colleges and universities. Online classes are great for students who have busy schedules or for those who just want to study on their own time.
In 2022-2023, 228 students took at least one online class at Visible Music College. This is an increase from the 192 students who took online classes the previous year.
| Year | Took at Least One Online Class | Took All Classes Online |
|---|---|---|
| 2022-2023 | 228 | 37 |
| 2021-2022 | 192 | 33 |
| 2020-2021 | 336 | 16 |
| 2018-2019 | 6 | 6 |
Footnotes
*The racial-ethnic minorities count is calculated by taking the total number of students and subtracting white students, international students, and students whose race/ethnicity was unknown. This number is then divided by the total number of students at the school to obtain the racial-ethnic minorities percentage.
References
More about our data sources and methodologies.