We've gathered data and other essential information about the program, such as the ethnicity of students, how many students graduated in recent times, and more. Also, learn how VSCC ranks among other schools offering degrees in music.
Jump to any of the following sections:
Learn about start dates, transferring credits, availability of financial aid, and more by contacting the universities below.
Earn the music business degree that fits into the business world – and partners Southern New Hampshire University with world-renowned Berklee College of Music.
The music major at VSCC is not ranked on College Factual’s Best Colleges and Universities for Music. This could be for a number of reasons, such as not having enough data on the major or school to make an accurate assessment of its quality.
In 2022-2023, the average part-time undergraduate tuition at VSCC was $726 per credit hour for out-of-state students. The average for in-state students was $176 per credit hour. The following table shows the average full-time tuition and fees for undergraduates.
| In State | Out of State | |
|---|---|---|
| Tuition | $4,224 | $17,424 |
| Fees | $300 | $300 |
| Books and Supplies | $1,460 | $1,460 |
Learn more about VSCC tuition and fees.
VSCC does not offer an online option for its music bachelor’s degree program at this time. To see if the school offers distance learning options in other areas, visit the VSCC Online Learning page.
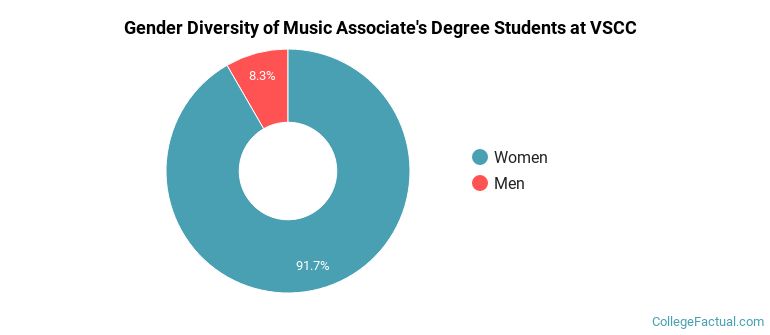
During the 2021-2022 academic year, 12 music majors earned their associate's degree from VSCC. Of these graduates, 8% were men and 92% were women.
The majority of associate's degree recipients in this major at VSCC are white. In the most recent graduating class for which data is available, 75% of students fell into this category.
The following table and chart show the ethnic background for students who recently graduated from Volunteer State Community College with a associate's in music.
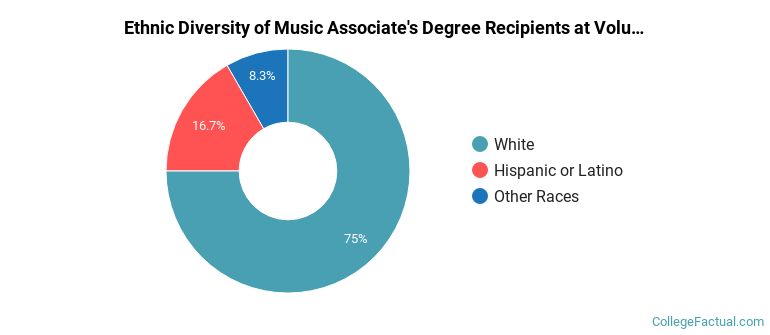
| Ethnic Background | Number of Students |
|---|---|
| Asian | 0 |
| Black or African American | 0 |
| Hispanic or Latino | 2 |
| White | 9 |
| Non-Resident Aliens | 0 |
| Other Races | 1 |
| Related Major | Annual Graduates |
|---|---|
| General Visual & Performing Arts | 33 |
