Walsh total enrollment is approximately 2,651 students. 1,531 are undergraduates and 350 are graduate students.
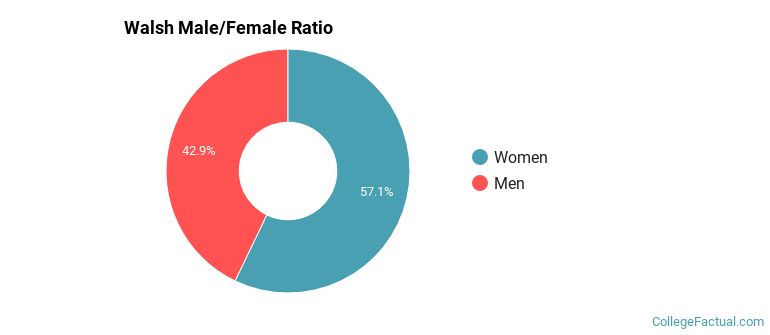
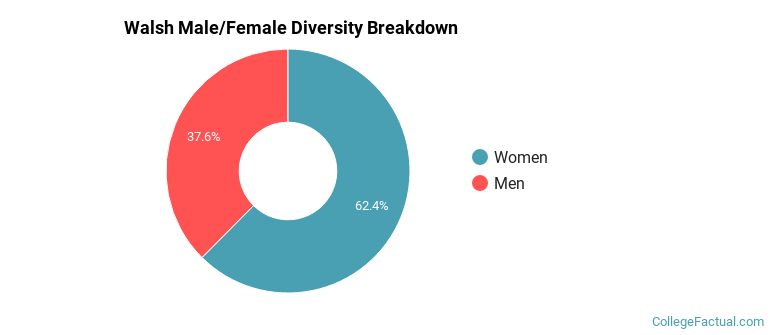
Male/Female Breakdown of Undergraduates
The full-time Walsh undergraduate population is made up of 55% women, and 45% men.
For the gender breakdown for all students, go here.
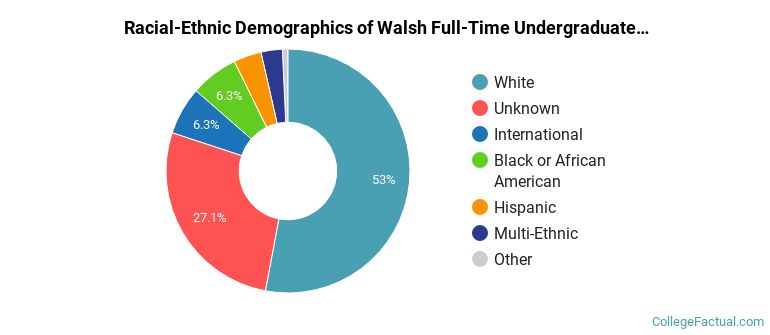
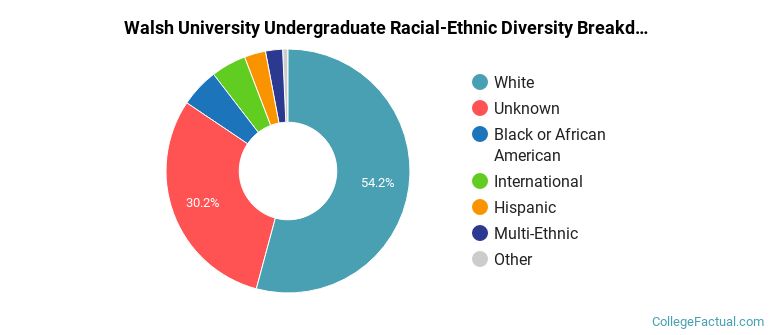
Walsh Racial/Ethnic Breakdown of Undergraduates
| Race/Ethnicity | Number |
|---|---|
| White | 696 |
| Unknown | 537 |
| International | 113 |
| Black or African American | 86 |
| Hispanic | 45 |
| Multi-Ethnic | 42 |
| Asian | 10 |
| Native Hawaiian or Pacific Islander | 0 |
See racial/ethnic breakdown for all students.
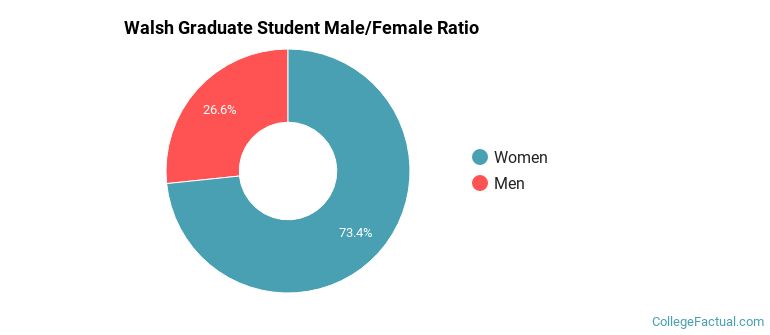
Male/Female Breakdown of Graduate Students
About 75% of full-time grad students are women, and 25% men.
For the gender breakdown for all students, go here.
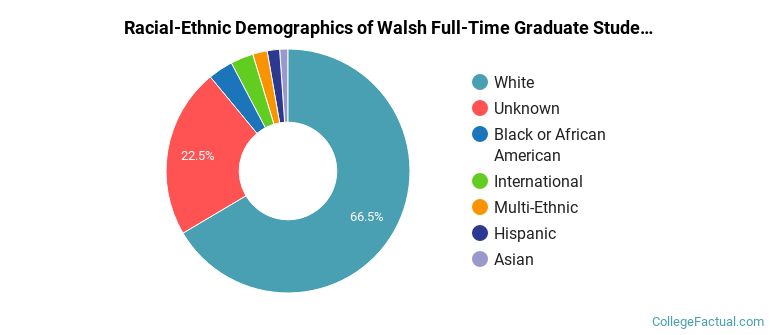
Walsh Racial-Ethnic Breakdown of Graduate Students
| Race/Ethnicity | Number |
|---|---|
| White | 217 |
| Unknown | 95 |
| Black or African American | 14 |
| Hispanic | 11 |
| International | 6 |
| Multi-Ethnic | 5 |
| Asian | 2 |
| Native Hawaiian or Pacific Islander | 0 |
See racial/ethnic breakdown for all students.
| Race/Ethnicity | Number |
|---|---|
| White | 1,305 |
| Unknown | 928 |
| International | 138 |
| Black or African American | 134 |
| Hispanic | 70 |
| Multi-Ethnic | 59 |
| Asian | 15 |
| Native Hawaiian or Pacific Islander | 0 |
There are approximately 1,671 female students and 980 male students at Walsh.
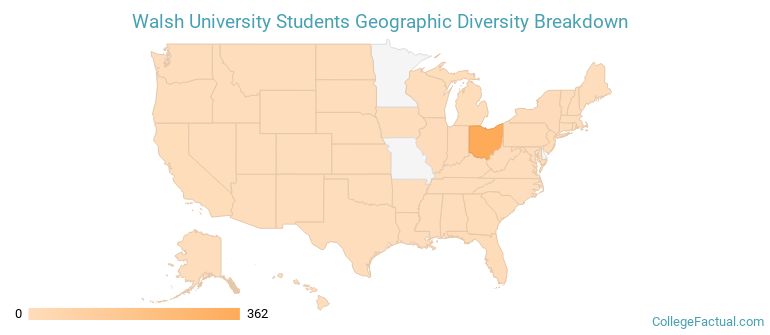
Walsh ranks 1,169 out of 2,183 when it comes to geographic diversity.
14.62% of Walsh students come from out of state, and 3.64% come from out of the country.
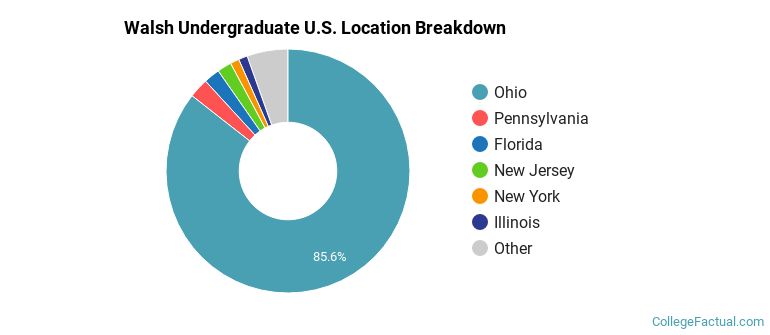
The undergraduate student body is split among 19 states (may include Washington D.C.). Click on the map for more detail.
| State | Amount |
|---|---|
| Ohio | 362 |
| Pennsylvania | 11 |
| Florida | 9 |
| New Jersey | 8 |
| Illinois | 5 |
Students from 37 countries are represented at this school, with the majority of the international students coming from Saudi Arabia, Canada, and Bolivia.
Learn more about international students at Walsh.
A traditional college student is defined as being between the ages of 18-21. At Walsh, 49.62% of students fall into that category, compared to the national average of 60%.
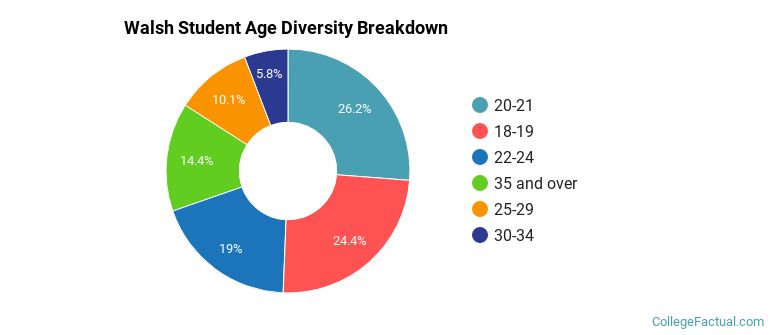
| Student Age Group | Amount |
|---|---|
| 20-21 | 709 |
| 18-19 | 660 |
| 22-24 | 515 |
| 35 and over | 389 |
| 25-29 | 274 |
| 30-34 | 157 |
| Under 18 | 0 |
Footnotes
*The racial-ethnic minorities count is calculated by taking the total number of students and subtracting white students, international students, and students whose race/ethnicity was unknown. This number is then divided by the total number of students at the school to obtain the racial-ethnic minorities percentage.
References