Explore the best ranked schools for the programs you are most interested in.
According to College Factual's 2025 analysis, WSCC is ranked #1,895 out of 2,152 schools in the nation that were analyzed for overall quality.
WSCC is also ranked #83 out of 91 schools in Ohio.
See all of the rankings for Washington State Community College.
If you are worried about getting into Washington State Community College, don't be. The school has a liberal open admissions policy, which means you only need to meet basic requirements in order to be admitted. Still, be sure to submit a complete application and provide any other requested materials.
The student to faculty ratio at Washington State Community College is about average at 14 to 1. This ratio is often used to gauge how many students might be in an average class and how much time professors will have to spend with their students on an individual level. The national average for this metric is 15 to 1.
When estimating how much access students will have to their teachers, some people like to look at what percentage of faculty members are full time. This is because part-time teachers may not have as much time to spend on campus as their full-time counterparts.
The full-time faculty percentage at Washington State Community College is 23%. This is lower than the national average of 47%.
The freshmen retention rate is a sign of how many full-time students like a college or university well enough to come back for their sophomore year. At Washington State Community College this rate is 51%, which is a bit lower than the national average of 68%.
During the 2017-2018 academic year, there were 1,809 undergraduates at WSCC with 611 being full-time and 1,198 being part-time.
| $0-30 K | $30K-48K | $48-75 | $75-110K | $110K + |
|---|---|---|---|---|
| $5,916 | $7,215 | $8,185 | $10,759 | $11,956 |
The net price is calculated by adding tuition, room, board and other costs and subtracting financial aid.Note that the net price is typically less than the published for a school. For more information on the sticker price of WSCC, see our tuition and fees and room and board pages.
While almost two-thirds of students nationwide take out loans to pay for college, the percentage may be quite different for the school you plan on attending. At WSCC, approximately 29% of students took out student loans averaging $5,666 a year. That adds up to $22,664 over four years for those students.
Get more details about paying for Washington State Community College.
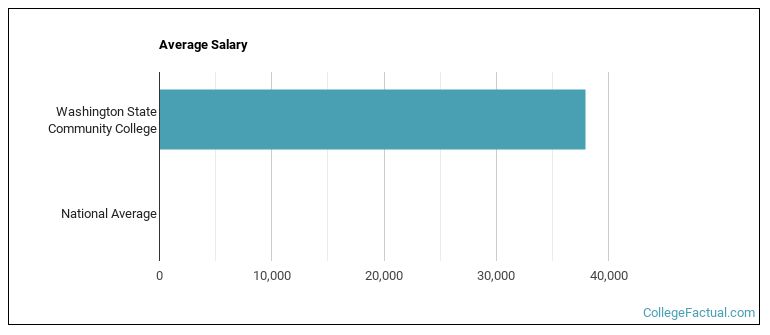
See which majors at Washington State Community College make the most money.
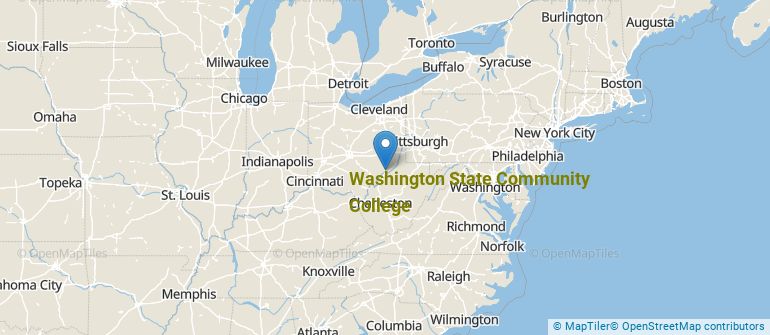
Get more details about the location of Washington State Community College.
Contact details for WSCC are given below.
| Contact Details | |
|---|---|
| Address: | 710 Colegate Dr, Marietta, OH 45750 |
| Phone: | 740-374-8716 |
| Website: | www.wscc.edu/ |
| Most Popular Majors | Bachelor’s Degrees | Average Salary of Graduates |
|---|---|---|
| Liberal Arts General Studies | 82 | NA |
| Nursing | 47 | NA |
| Practical Nursing & Nursing Assistants | 40 | NA |
| Vehicle Maintenance & Repair | 35 | NA |
| Allied Health & Medical Assisting Services | 33 | NA |
| Criminal Justice & Corrections | 30 | NA |
| Accounting | 29 | NA |
| Business Administration & Management | 27 | NA |
| Allied Health Professions | 27 | NA |
| Security Science and Technology | 22 | NA |
Online courses area a great option for busy, working students as well as for those who have scheduling conflicts and want to study on their own time. As time goes by, expect to see more and more online learning options become available.
In 2022-2023, 1,048 students took at least one online class at Washington State Community College. This is a decrease from the 1,069 students who took online classes the previous year.
| Year | Took at Least One Online Class | Took All Classes Online |
|---|---|---|
| 2022-2023 | 1,048 | 220 |
| 2021-2022 | 1,069 | 170 |
| 2020-2021 | 908 | 224 |
| 2018-2019 | 880 | 208 |
Learn more about online learning at Washington State Community College.
Footnotes
*The racial-ethnic minorities count is calculated by taking the total number of students and subtracting white students, international students, and students whose race/ethnicity was unknown. This number is then divided by the total number of students at the school to obtain the racial-ethnic minorities percentage.
References
More about our data sources and methodologies.
