Wazzu total enrollment is approximately 31,159 students. 22,315 are undergraduates and 3,661 are graduate students.
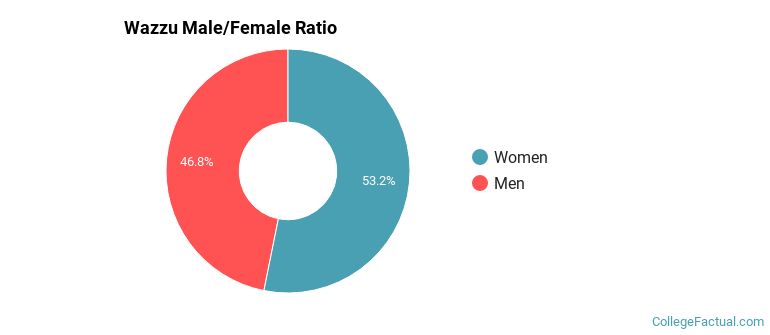
Male/Female Breakdown of Undergraduates
The full-time Wazzu undergraduate population is made up of 54% women, and 46% men.
For the gender breakdown for all students, go here.
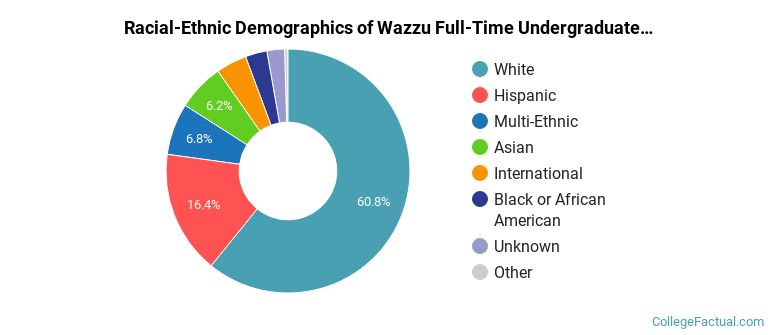
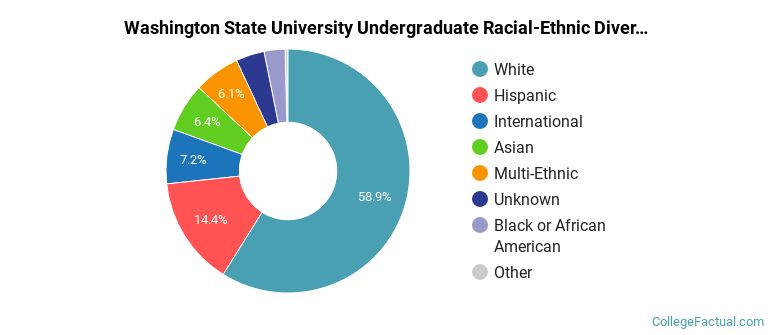
Wazzu Racial/Ethnic Breakdown of Undergraduates
| Race/Ethnicity | Number |
|---|---|
| White | 13,429 |
| Hispanic | 3,761 |
| Multi-Ethnic | 1,575 |
| Asian | 1,354 |
| International | 855 |
| Black or African American | 636 |
| Unknown | 501 |
| Native Hawaiian or Pacific Islander | 94 |
See racial/ethnic breakdown for all students.
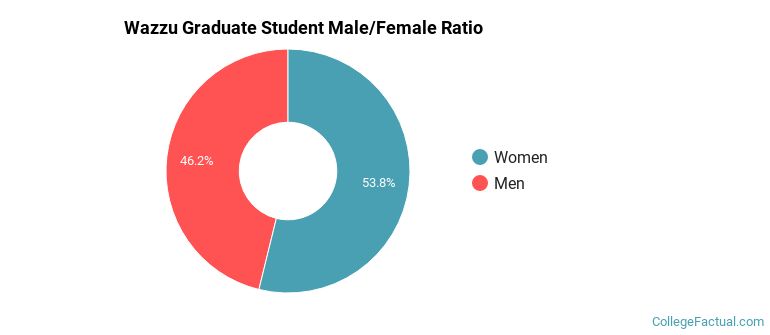
Male/Female Breakdown of Graduate Students
About 56% of full-time grad students are women, and 44% men.
For the gender breakdown for all students, go here.
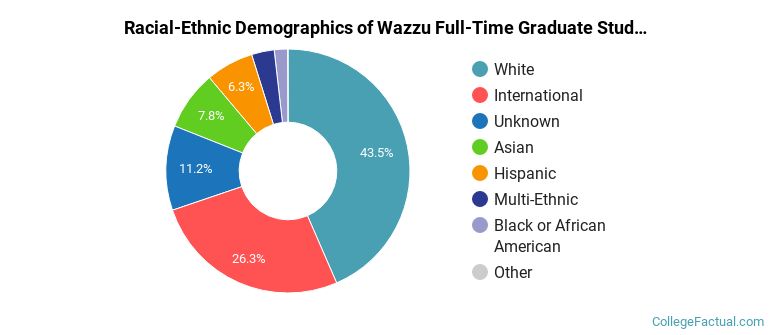
Wazzu Racial-Ethnic Breakdown of Graduate Students
| Race/Ethnicity | Number |
|---|---|
| White | 1,783 |
| International | 781 |
| Asian | 322 |
| Unknown | 293 |
| Hispanic | 261 |
| Multi-Ethnic | 126 |
| Black or African American | 72 |
| Native Hawaiian or Pacific Islander | 6 |
See racial/ethnic breakdown for all students.
| Race/Ethnicity | Number |
|---|---|
| White | 18,443 |
| Hispanic | 4,650 |
| Asian | 2,045 |
| Multi-Ethnic | 1,963 |
| International | 1,919 |
| Unknown | 981 |
| Black or African American | 892 |
| Native Hawaiian or Pacific Islander | 114 |

There are approximately 16,944 female students and 14,215 male students at Wazzu.
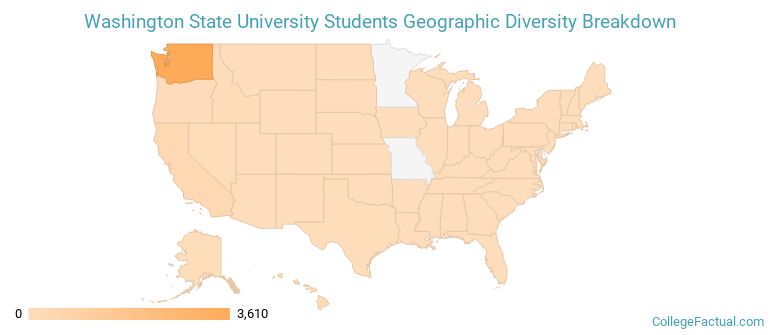
Wazzu ranks 592 out of 2,183 when it comes to geographic diversity.
17.45% of Wazzu students come from out of state, and 2.5% come from out of the country.
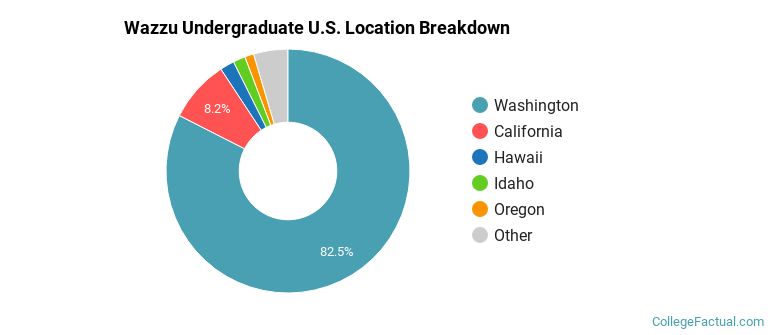
The undergraduate student body is split among 37 states (may include Washington D.C.). Click on the map for more detail.
| State | Amount |
|---|---|
| Washington | 3,610 |
| California | 360 |
| Hawaii | 83 |
| Idaho | 71 |
| Oregon | 52 |
Students from 101 countries are represented at this school, with the majority of the international students coming from China, India, and Saudi Arabia.
Learn more about international students at Wazzu.
A traditional college student is defined as being between the ages of 18-21. At Wazzu, 53.71% of students fall into that category, compared to the national average of 60%.
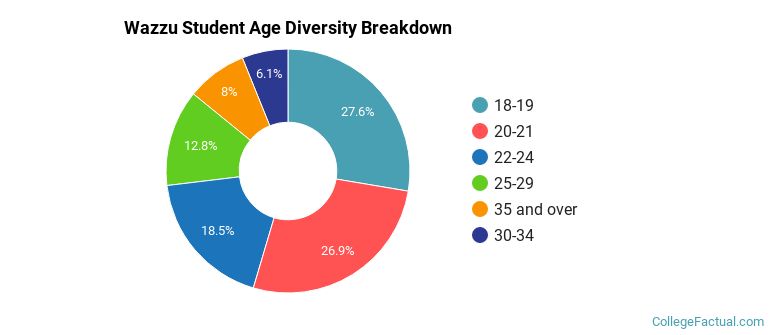
| Student Age Group | Amount |
|---|---|
| 18-19 | 8,326 |
| 20-21 | 8,117 |
| 22-24 | 5,574 |
| 25-29 | 3,851 |
| 35 and over | 2,416 |
| 30-34 | 1,838 |
| Under 18 | 0 |
Footnotes
*The racial-ethnic minorities count is calculated by taking the total number of students and subtracting white students, international students, and students whose race/ethnicity was unknown. This number is then divided by the total number of students at the school to obtain the racial-ethnic minorities percentage.
References
Department of Homeland Security Citizenship and Immigration Services
Find out how College Factual created their Diversity Rankings.