WUSTL total enrollment is approximately 15,449 students. 7,077 are undergraduates and 6,127 are graduate students.
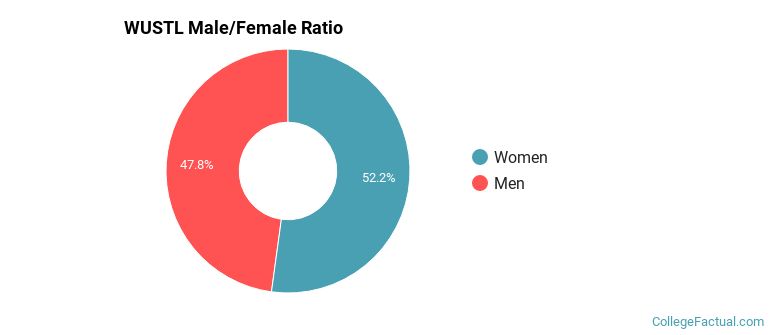
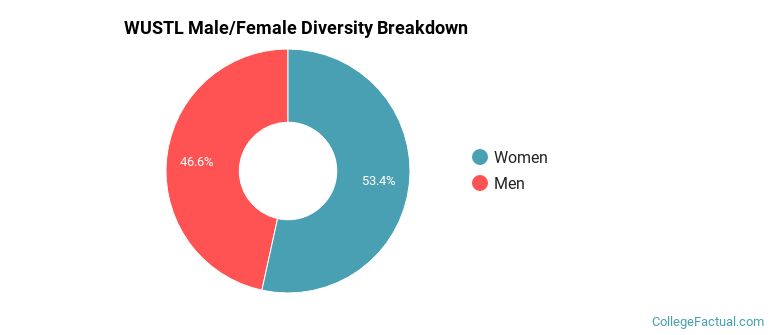
Male/Female Breakdown of Undergraduates
The full-time WUSTL undergraduate population is made up of 52% women, and 48% men.
For the gender breakdown for all students, go here.
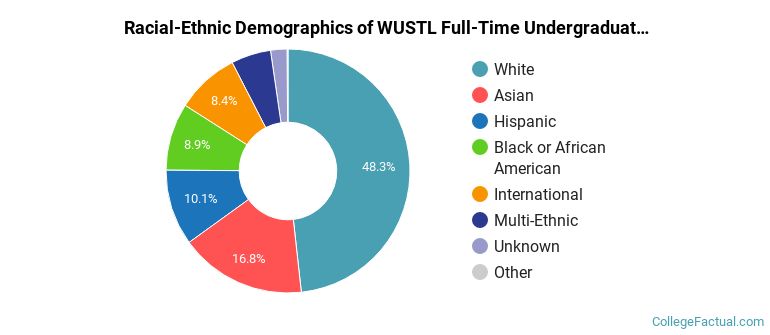
WUSTL Racial/Ethnic Breakdown of Undergraduates
| Race/Ethnicity | Number |
|---|---|
| White | 3,335 |
| Asian | 1,319 |
| Hispanic | 764 |
| Black or African American | 580 |
| International | 522 |
| Multi-Ethnic | 392 |
| Unknown | 147 |
| Native Hawaiian or Pacific Islander | 10 |
See racial/ethnic breakdown for all students.
Male/Female Breakdown of Graduate Students
About 52% of full-time grad students are women, and 48% men.

For the gender breakdown for all students, go here.
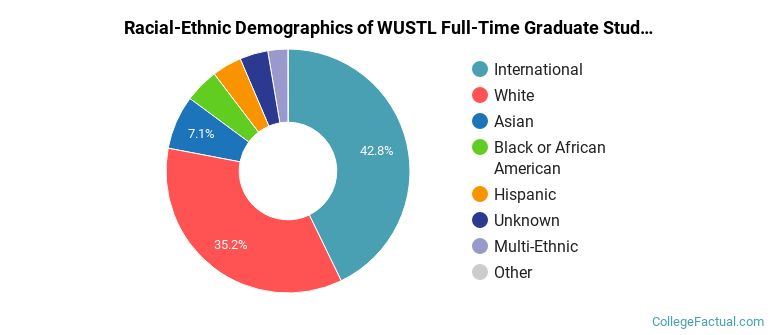
WUSTL Racial-Ethnic Breakdown of Graduate Students
| Race/Ethnicity | Number |
|---|---|
| International | 2,347 |
| White | 2,331 |
| Asian | 496 |
| Black or African American | 316 |
| Hispanic | 276 |
| Unknown | 168 |
| Multi-Ethnic | 165 |
| Native Hawaiian or Pacific Islander | 4 |
See racial/ethnic breakdown for all students.
| Race/Ethnicity | Number |
|---|---|
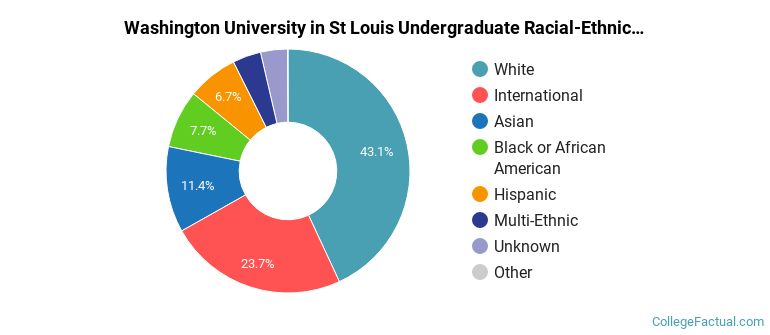
| White | 6,766 |
| International | 3,252 |
| Asian | 1,998 |
| Black or African American | 1,173 |
| Hispanic | 1,161 |
| Multi-Ethnic | 617 |
| Unknown | 433 |
| Native Hawaiian or Pacific Islander | 14 |
There are approximately 8,165 female students and 7,284 male students at WUSTL.
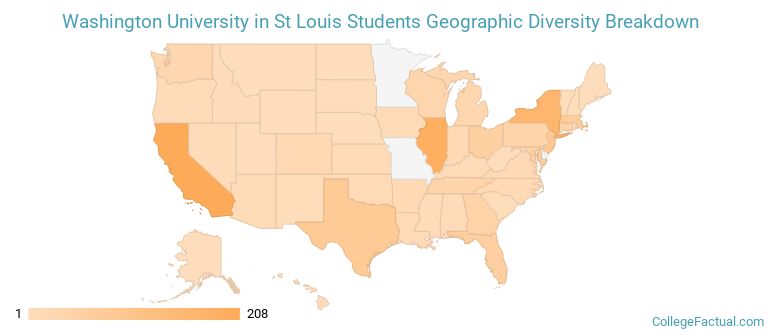
WUSTL ranks 13 out of 2,183 when it comes to geographic diversity.
89.6% of WUSTL students come from out of state, and 7.32% come from out of the country.
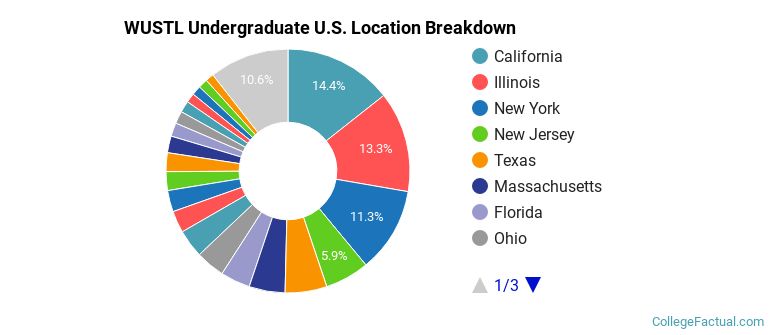
The undergraduate student body is split among 49 states (may include Washington D.C.). Click on the map for more detail.
| State | Amount |
|---|---|
| California | 208 |
| Illinois | 193 |
| New York | 163 |
| New Jersey | 85 |
| Texas | 80 |
Students from 94 countries are represented at this school, with the majority of the international students coming from China, South Korea, and India.
Learn more about international students at WUSTL.
A traditional college student is defined as being between the ages of 18-21. At WUSTL, 43.34% of students fall into that category, compared to the national average of 60%.
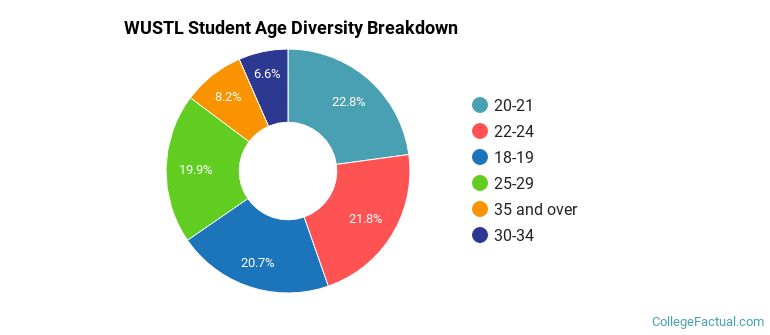
| Student Age Group | Amount |
|---|---|
| 20-21 | 3,477 |
| 22-24 | 3,318 |
| 18-19 | 3,156 |
| 25-29 | 3,021 |
| 35 and over | 1,249 |
| 30-34 | 998 |
| Under 18 | 0 |
Footnotes
*The racial-ethnic minorities count is calculated by taking the total number of students and subtracting white students, international students, and students whose race/ethnicity was unknown. This number is then divided by the total number of students at the school to obtain the racial-ethnic minorities percentage.
References
Department of Homeland Security Citizenship and Immigration Services
Image Credit: By Bachrach44 under License
Learn more about how College Factual creates their Diversity Rankings.