 by our College Data Analytics Team
Here is an overview of this program at WSC. You can study it at the Bachelor’s level. Its best result is a rank of #3 out of 7 schools (Bachelor’s level) by College Factual. Jump to any of the following sections:
College Factual rates WSC highly for teacher education subject specific, placing at #258 out of 554 schools nationally.
The following degree levels are offered in teacher education subject specific at WSC, along with how many graduates complete each level annually.
| Degree Level | Annual Graduates |
|---|---|
| Bachelor’s | 76 |
For the most recent IPEDS reporting year, Wayne State College handed out 76 bachelor’s degrees in teacher education subject specific.
WSC is in the top 15% of the country for teacher education subject specific at the bachelor’s level. In particular it placed #3 out of 7 schools by College Factual.
Teacher Education Subject Specific majors who earn their bachelor’s degree from WSC go on to jobs where they make a median salary of $46,318 a year. This is below $48,788, the median for all majors at WSC.
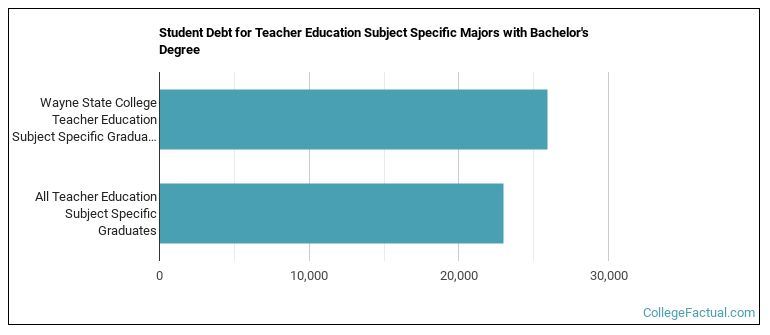
While getting their bachelor’s degree at WSC, teacher education subject specific graduates take on a median debt of $25,957 in student loans. This is higher than $22,974, the typical median for all majors at WSC.
Average full-time tuition and fees are listed in the table below.
| In State | Out of State | |
|---|---|---|
| Tuition | $5,700 | $5,880 |
| Fees | $2,291 | $2,291 |
Find out more about WSC tuition and fees.
Among recent graduates, 43% of teacher education subject specific bachelor’s degrees went to men and 57% went to women.
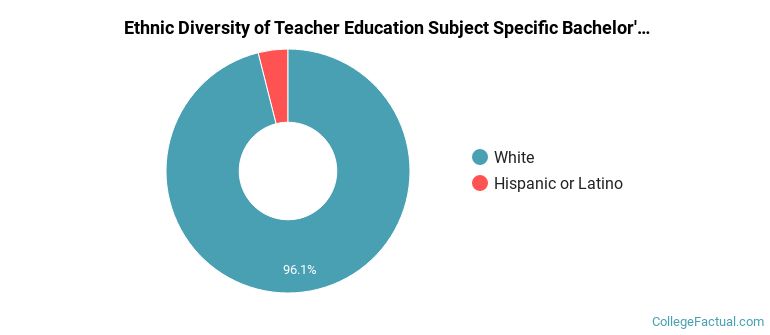
 The majority of teacher education subject specific bachelor’s degree graduates at WSC are White. About 96% of graduates fell into this category.
The following table and chart show the ethnic background for students who recently graduated from Wayne State College with a bachelor’s in teacher education subject specific.
| Ethnic Background | Number of Students |
|---|---|
| Asian | 0 |
| Black or African American | 0 |
| Hispanic or Latino | 3 |
| White | 73 |
| Non-Resident Aliens | 0 |
| Other Races | 0 |
WSC granted 19 bachelor’s degrees in physical education teaching and coaching recently — 26% to women and 74% to men. The largest share of these graduates were White (100%).
WSC conferred 14 bachelor’s completions in social science teacher education in the latest year of data — 29% to women and 71% to men. The largest share of these graduates were White (93%).
WSC granted 12 bachelor’s completions in english/language arts teacher education in the latest year of data — 83% to women and 17% to men. The largest share of these graduates were White (92%).
WSC granted 6 bachelor’s degrees in family and consumer sciences/home economics teacher education in the latest year of data — 100% to women and 0% to men. The most common background among these graduates was White (83%).
WSC awarded 6 bachelor’s completions in music teacher education in the most recent reporting year — 67% to women and 33% to men. Most of these graduates identified as White (100%).
WSC awarded 5 bachelor’s completions in art teacher education recently — 100% to women and 0% to men. The most common background among these graduates was White (100%).
WSC conferred 5 bachelor’s degrees in technology teacher education/industrial arts teacher education in the most recent reporting year — 20% to women and 80% to men. The largest share of these graduates were White (100%).
WSC awarded 4 bachelor’s completions in mathematics teacher education in the most recent reporting year — 100% to women and 0% to men. The largest share of these graduates were White (100%).
WSC granted 3 bachelor’s completions in science teacher education/general science teacher education in the latest year of data — 67% to women and 33% to men. Most of these graduates identified as White (100%).
WSC conferred 1 bachelor’s completion in business and innovation/entrepreneurship teacher education in the latest year of data — 100% to women and 0% to men. The most common background among these graduates was White (100%).
WSC granted 1 bachelor’s completion in foreign language teacher education in the latest year of data — 100% to women and 0% to men. Most of these graduates identified as White (100%).
