We've gathered data and other essential information about the program, such as the average salary of graduates, ethnicity of students, how many students graduated in recent times, and more. In addition, we cover how Wayne State ranks in comparison to other schools with criminal justice programs.
Jump to any of the following sections:
The bachelor's program at Wayne State was ranked #246 on College Factual's Best Schools for criminal justice list. It is also ranked #13 in Michigan.
| Ranking Type | Rank |
|---|---|
| Best Criminal Justice & Corrections Bachelor’s Degree Schools | 176 |
| Best Criminal Justice & Corrections Schools | 246 |
During the 2021-2022 academic year, Wayne State University handed out 111 bachelor's degrees in criminal justice & corrections. This is an increase of 6% over the previous year when 105 degrees were handed out.
In 2022, 19 students received their master’s degree in criminal justice from Wayne State. This makes it the #88 most popular school for criminal justice master’s degree candidates in the country.
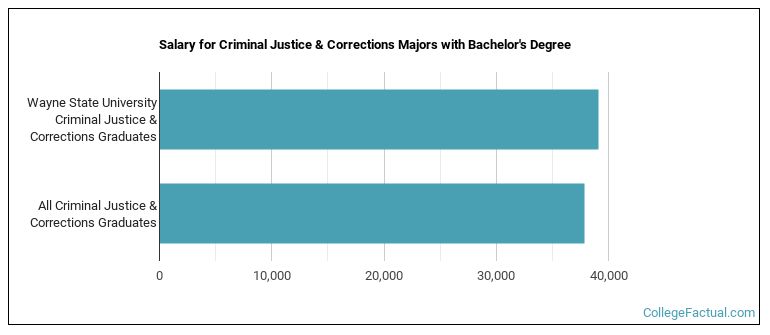
The median salary of criminal justice students who receive their bachelor's degree at Wayne State is $39,132. This is great news for graduates of the program, since this figure is higher than the national average of $37,901 for all criminal justice bachelor's degree recipients.
While getting their bachelor's degree at Wayne State, criminal justice students borrow a median amount of $23,606 in student loans. This is higher than the the typical median of $20,504 for all criminal justice majors across the country.
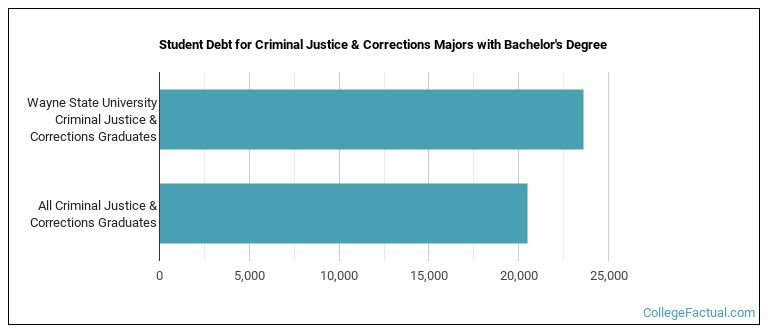
The typical student loan payment of a bachelor's degree student from the criminal justice program at Wayne State is $253 per month.
During the 2022-2023 academic year, part-time undergraduate students at Wayne State paid an average of $1,304 per credit hour if they came to the school from out-of-state. In-state students paid a discounted rate of $568 per credit hour. Information about average full-time undergraduate tuition and fees is shown in the table below.
| In State | Out of State | |
|---|---|---|
| Tuition | $13,660 | $31,354 |
| Fees | $1,804 | $1,804 |
| Books and Supplies | $1,316 | $1,316 |
| On Campus Room and Board | $11,762 | $11,762 |
| On Campus Other Expenses | $4,410 | $4,410 |
Learn more about Wayne State tuition and fees.
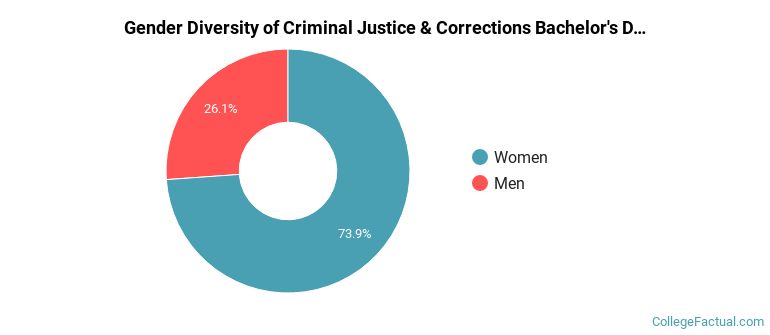
For the most recent academic year available, 26% of criminal justice bachelor's degrees went to men and 74% went to women.
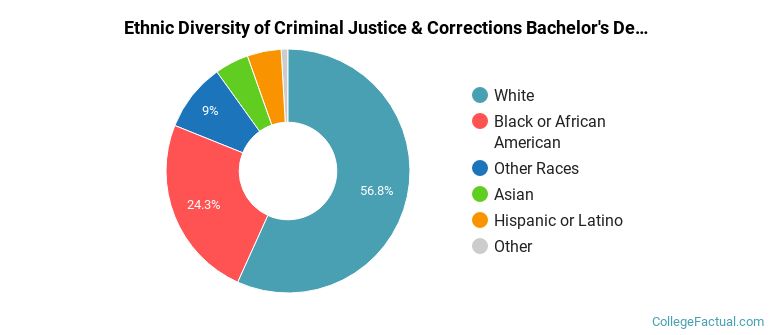
The majority of bachelor's degree recipients in this major at Wayne State are white. In the most recent graduating class for which data is available, 57% of students fell into this category.
The following table and chart show the ethnic background for students who recently graduated from Wayne State University with a bachelor's in criminal justice.
| Ethnic Background | Number of Students |
|---|---|
| Asian | 5 |
| Black or African American | 27 |
| Hispanic or Latino | 5 |
| White | 63 |
| Non-Resident Aliens | 1 |
| Other Races | 10 |
Online degrees for the Wayne State criminal justice bachelor’s degree program are not available at this time. To see if the school offers distance learning options in other areas, visit the Wayne State Online Learning page.
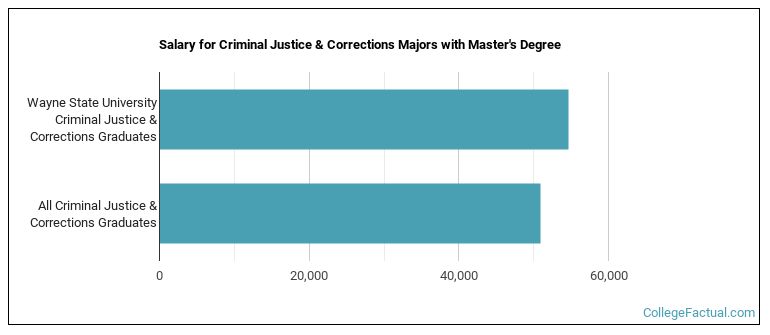
Criminal Justice majors graduating with a master's degree from Wayne State make a median salary of $54,708 a year. This is a better than average outcome since the median salary for all criminal justice graduates with a master's is $50,954.
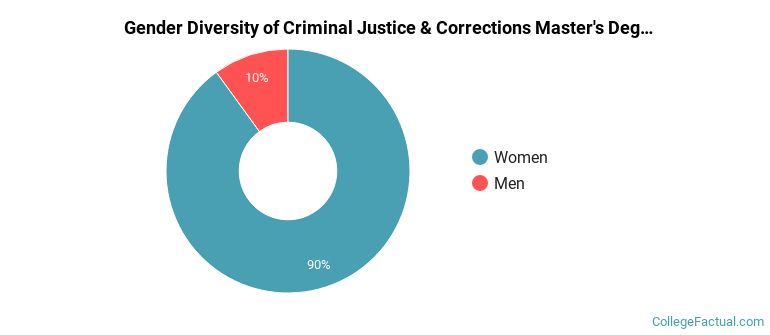
During the 2021-2022 academic year, 10 criminal justice majors earned their master's degree from Wayne State. Of these graduates, 10% were men and 90% were women.
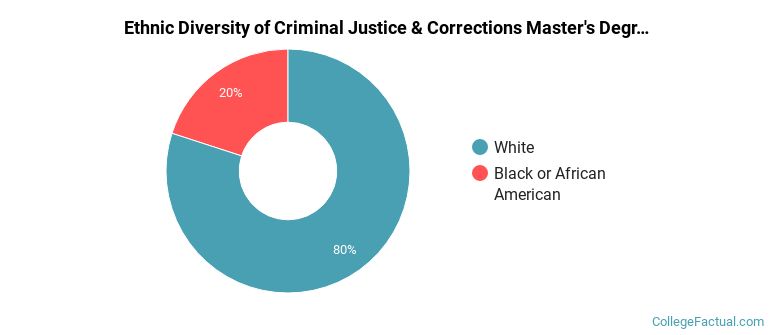
The majority of master's degree recipients in this major at Wayne State are white. In the most recent graduating class for which data is available, 80% of students fell into this category.
The following table and chart show the ethnic background for students who recently graduated from Wayne State University with a master's in criminal justice.
| Ethnic Background | Number of Students |
|---|---|
| Asian | 0 |
| Black or African American | 2 |
| Hispanic or Latino | 0 |
| White | 8 |
| Non-Resident Aliens | 0 |
| Other Races | 0 |
Take a look at the following statistics related to the make-up of the criminal justice majors at Wayne State University.
More about our data sources and methodologies.