Wayne State total enrollment is approximately 26,241 students. 13,407 are undergraduates and 5,424 are graduate students.
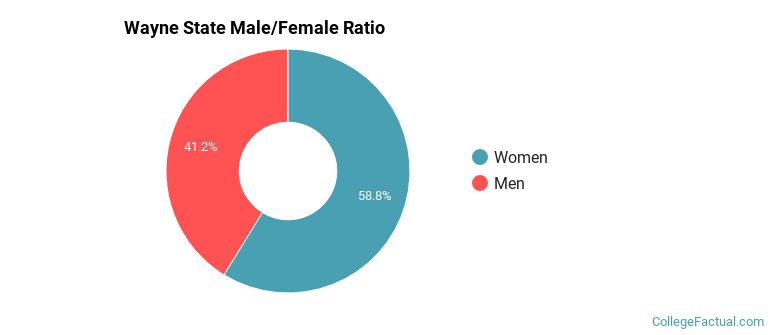
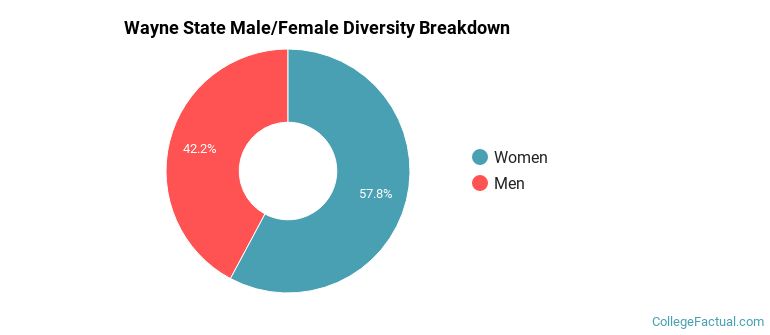
Male/Female Breakdown of Undergraduates
The full-time Wayne State undergraduate population is made up of 60% women, and 40% men.
For the gender breakdown for all students, go here.
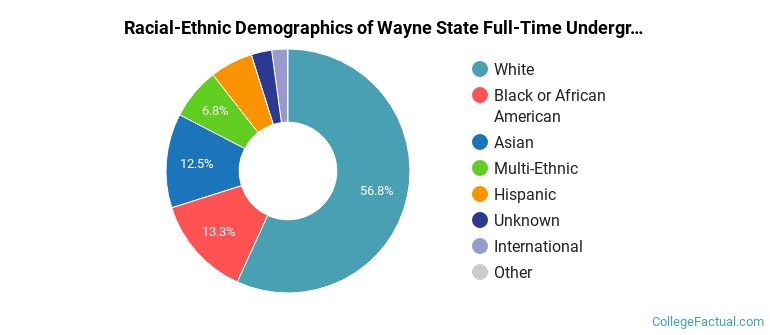
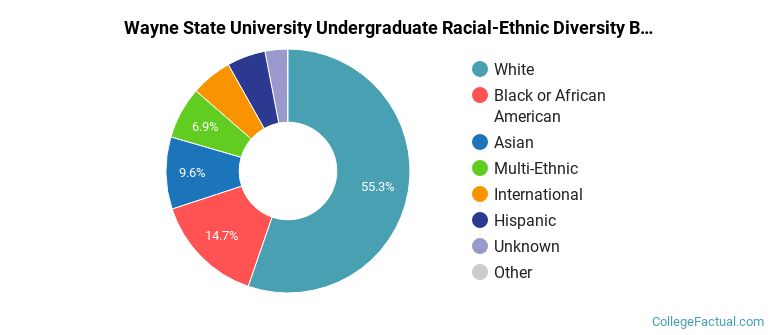
Wayne State Racial/Ethnic Breakdown of Undergraduates
| Race/Ethnicity | Number |
|---|---|
| White | 7,426 |
| Black or African American | 1,927 |
| Asian | 1,743 |
| Multi-Ethnic | 866 |
| Hispanic | 848 |
| Unknown | 331 |
| International | 231 |
| Native Hawaiian or Pacific Islander | 8 |
See racial/ethnic breakdown for all students.
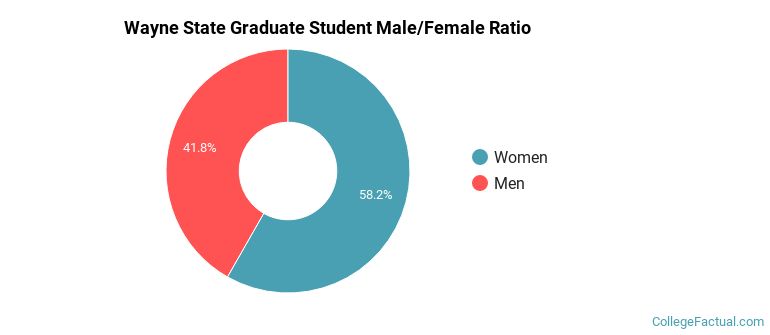
Male/Female Breakdown of Graduate Students
About 60% of full-time grad students are women, and 40% men.
For the gender breakdown for all students, go here.
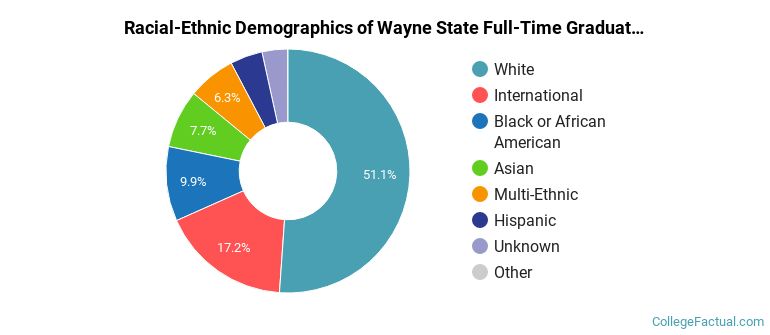
Wayne State Racial-Ethnic Breakdown of Graduate Students
| Race/Ethnicity | Number |
|---|---|
| White | 2,871 |
| International | 740 |
| Black or African American | 548 |
| Asian | 457 |
| Multi-Ethnic | 381 |
| Hispanic | 240 |
| Unknown | 161 |
| Native Hawaiian or Pacific Islander | 2 |
See racial/ethnic breakdown for all students.
| Race/Ethnicity | Number |
|---|---|
| White | 14,540 |
| Black or African American | 3,901 |
| Asian | 2,680 |
| Multi-Ethnic | 1,800 |
| Hispanic | 1,447 |
| International | 1,118 |
| Unknown | 672 |
| Native Hawaiian or Pacific Islander | 15 |
There are approximately 15,568 female students and 10,673 male students at Wayne State.
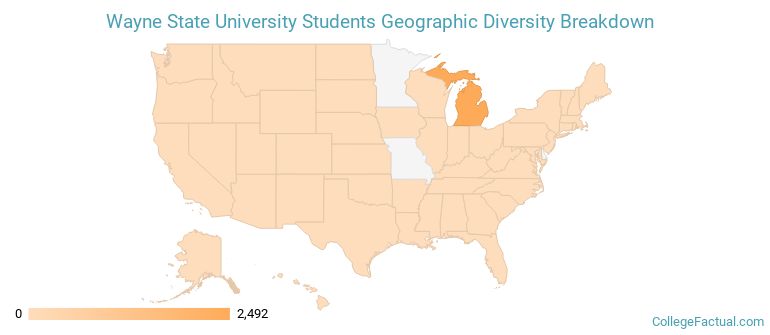
Wayne State ranks 1,692 out of 2,183 when it comes to geographic diversity.
1.65% of Wayne State students come from out of state, and 1.78% come from out of the country.
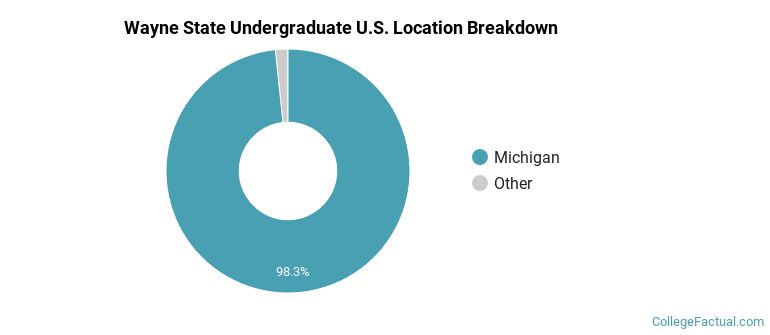
The undergraduate student body is split among 18 states (may include Washington D.C.). Click on the map for more detail.
| State | Amount |
|---|---|
| Michigan | 2,492 |
| Illinois | 8 |
| Ohio | 7 |
| California | 4 |
| Texas | 4 |
Students from 75 countries are represented at this school, with the majority of the international students coming from India, Canada, and China.
Learn more about international students at Wayne State.
A traditional college student is defined as being between the ages of 18-21. At Wayne State, 34.55% of students fall into that category, compared to the national average of 60%.
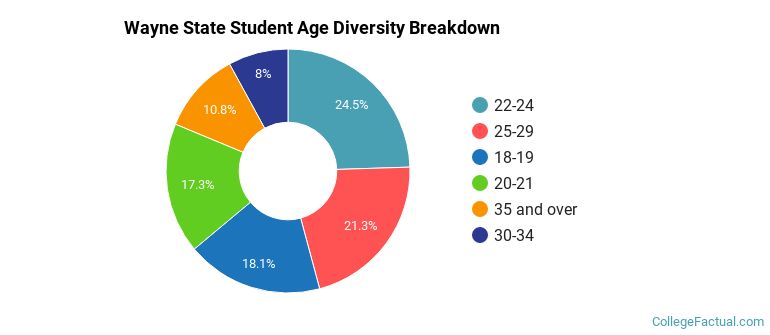
| Student Age Group | Amount |
|---|---|
| 22-24 | 6,461 |
| 25-29 | 5,626 |
| 18-19 | 4,778 |
| 20-21 | 4,572 |
| 35 and over | 2,843 |
| 30-34 | 2,099 |
| Under 18 | 0 |
Footnotes
*The racial-ethnic minorities count is calculated by taking the total number of students and subtracting white students, international students, and students whose race/ethnicity was unknown. This number is then divided by the total number of students at the school to obtain the racial-ethnic minorities percentage.
References
Department of Homeland Security Citizenship and Immigration Services
Find out how College Factual created their Diversity Rankings.