Waynesburg total enrollment is approximately 1,576 students. 1,208 are undergraduates and 115 are graduate students.
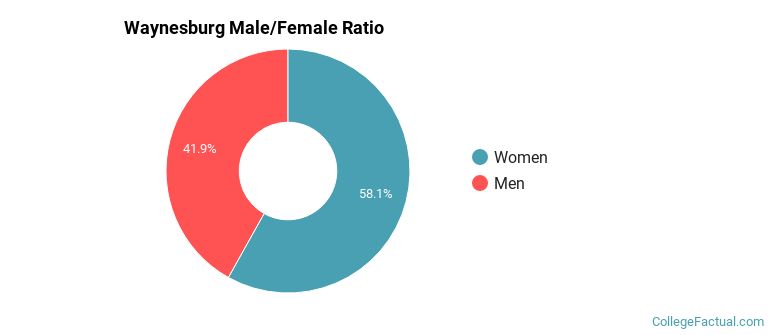
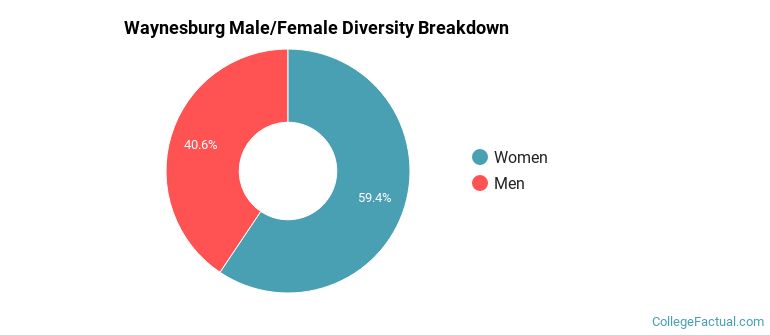
Male/Female Breakdown of Undergraduates
The full-time Waynesburg undergraduate population is made up of 57% women, and 43% men.
For the gender breakdown for all students, go here.
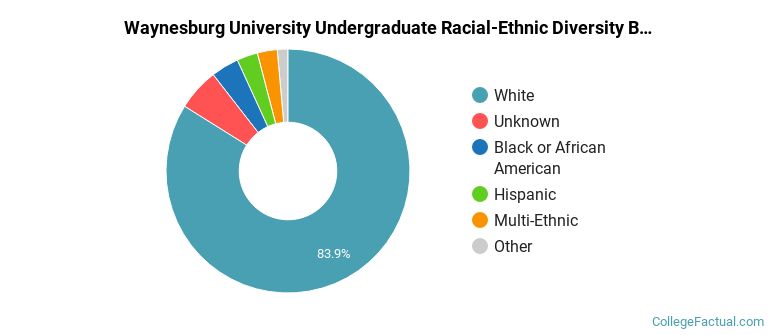
Waynesburg Racial/Ethnic Breakdown of Undergraduates
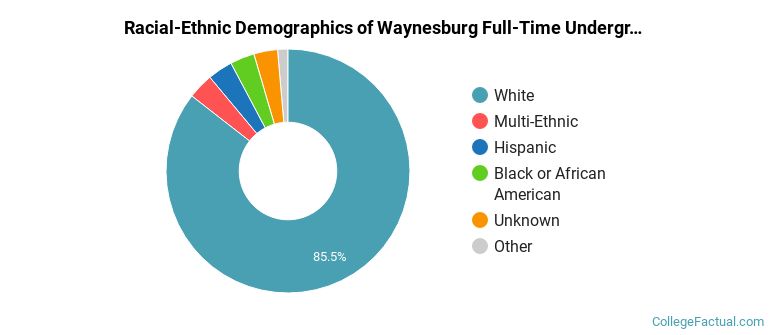
| Race/Ethnicity | Number |
|---|---|
| White | 1,027 |
| Hispanic | 45 |
| Unknown | 42 |
| Black or African American | 41 |
| Multi-Ethnic | 40 |
| Asian | 8 |
| Native Hawaiian or Pacific Islander | 2 |
| International | 2 |
See racial/ethnic breakdown for all students.
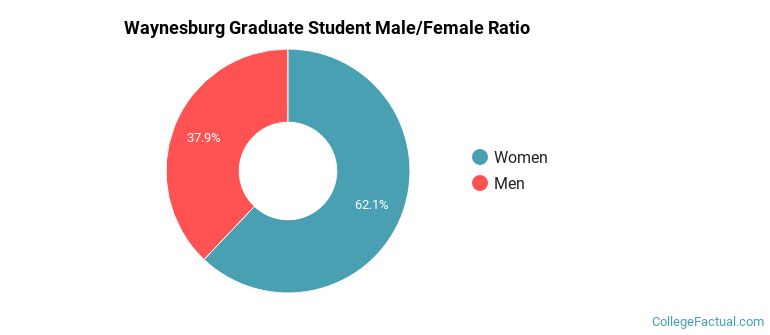
Male/Female Breakdown of Graduate Students
About 74% of full-time grad students are women, and 26% men.
For the gender breakdown for all students, go here.
Waynesburg Racial-Ethnic Breakdown of Graduate Students
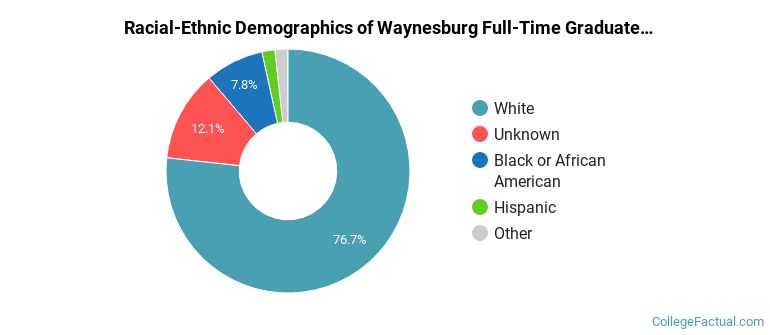
| Race/Ethnicity | Number |
|---|---|
| White | 91 |
| Black or African American | 12 |
| Unknown | 5 |
| Hispanic | 3 |
| Asian | 2 |
| International | 1 |
| Multi-Ethnic | 1 |
| Native Hawaiian or Pacific Islander | 0 |
See racial/ethnic breakdown for all students.
| Race/Ethnicity | Number |
|---|---|
| White | 1,325 |
| Unknown | 75 |
| Black or African American | 62 |
| Hispanic | 50 |
| Multi-Ethnic | 42 |
| Asian | 14 |
| Native Hawaiian or Pacific Islander | 3 |
| International | 3 |
There are approximately 953 female students and 623 male students at Waynesburg.
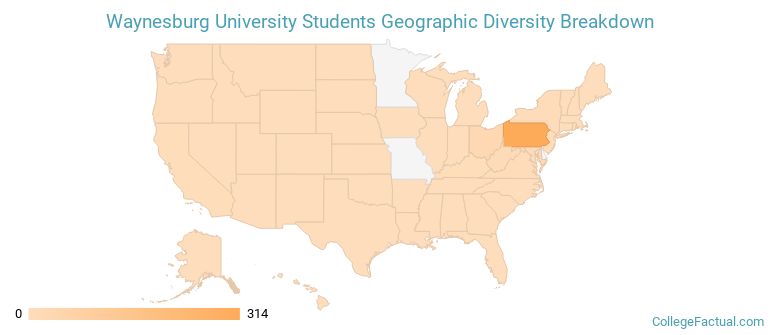
Waynesburg ranks 1,225 out of 2,183 when it comes to geographic diversity.
21.7% of Waynesburg students come from out of state, and 0% come from out of the country.
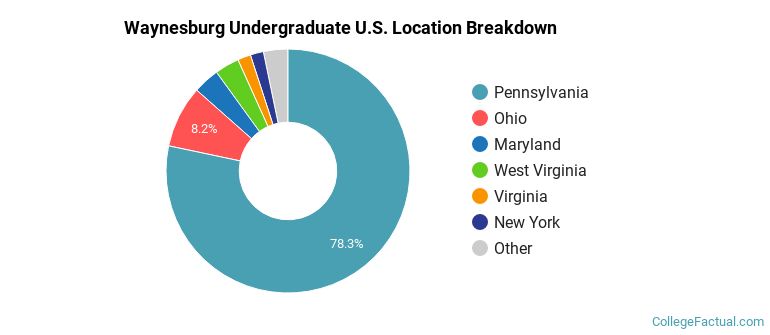
The undergraduate student body is split among 16 states (may include Washington D.C.). Click on the map for more detail.
| State | Amount |
|---|---|
| Pennsylvania | 314 |
| Ohio | 33 |
| Maryland | 14 |
| West Virginia | 13 |
| New York | 7 |
Students from 5 countries are represented at this school, with the majority of the international students coming from South Korea, Bahamas, and Saudi Arabia.
Learn more about international students at Waynesburg.
A traditional college student is defined as being between the ages of 18-21. At Waynesburg, 69.35% of students fall into that category, compared to the national average of 60%.
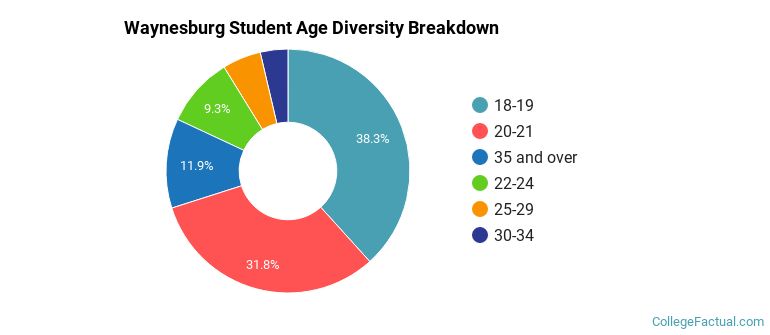
| Student Age Group | Amount |
|---|---|
| 18-19 | 658 |
| 20-21 | 546 |
| 35 and over | 204 |
| 22-24 | 159 |
| 25-29 | 88 |
| 30-34 | 63 |
| Under 18 | 0 |
Footnotes
*The racial-ethnic minorities count is calculated by taking the total number of students and subtracting white students, international students, and students whose race/ethnicity was unknown. This number is then divided by the total number of students at the school to obtain the racial-ethnic minorities percentage.
References