Wellesley total enrollment is approximately 2,280 students.
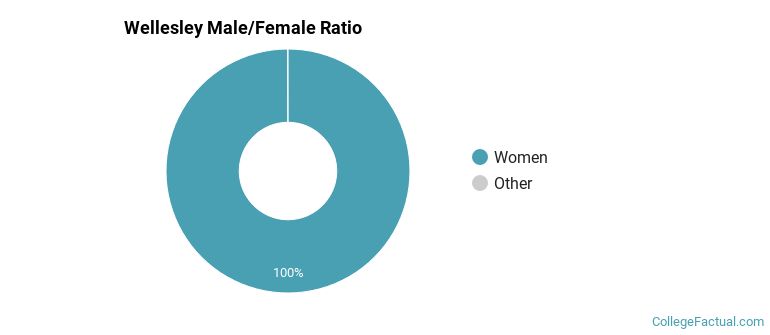
Male/Female Breakdown of Undergraduates
The full-time Wellesley undergraduate population is made up of 100% women, and 0% men.
For the gender breakdown for all students, go here.
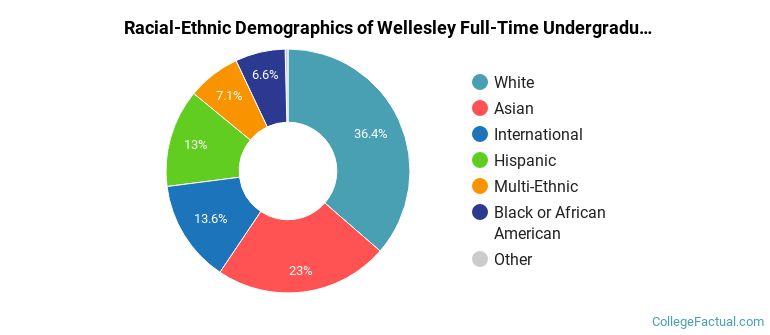
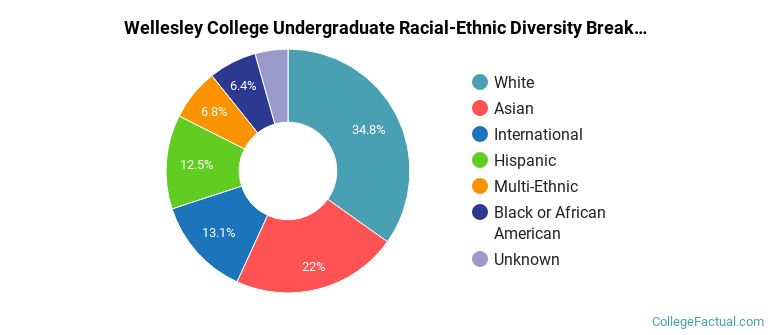
Wellesley Racial/Ethnic Breakdown of Undergraduates
| Race/Ethnicity | Number |
|---|---|
| White | 789 |
| Asian | 514 |
| Hispanic | 314 |
| International | 306 |
| Black or African American | 157 |
| Multi-Ethnic | 143 |
| Unknown | 12 |
| Native Hawaiian or Pacific Islander | 1 |
See racial/ethnic breakdown for all students.
| Race/Ethnicity | Number |
|---|---|
| White | 800 |
| Asian | 519 |
| Hispanic | 318 |
| International | 307 |
| Black or African American | 161 |
| Multi-Ethnic | 146 |
| Unknown | 26 |
| Native Hawaiian or Pacific Islander | 1 |
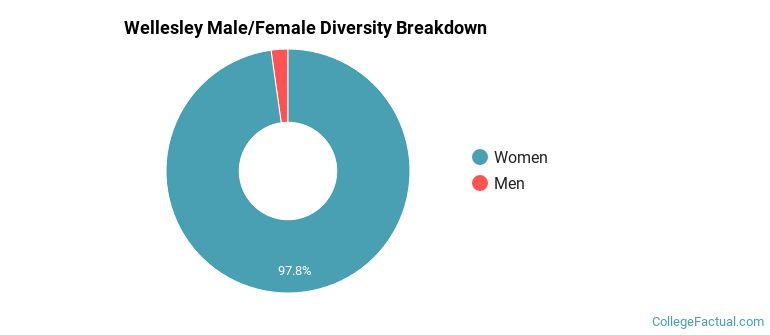
There are approximately 2,271 female students and 9 male students at Wellesley.
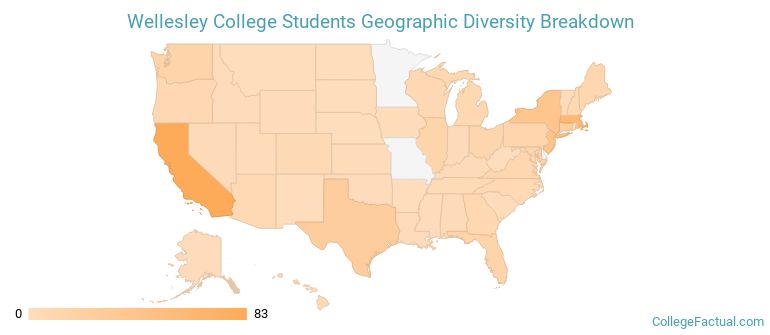
Wellesley ranks 23 out of 2,183 when it comes to geographic diversity.
87.5% of Wellesley students come from out of state, and 16.07% come from out of the country.
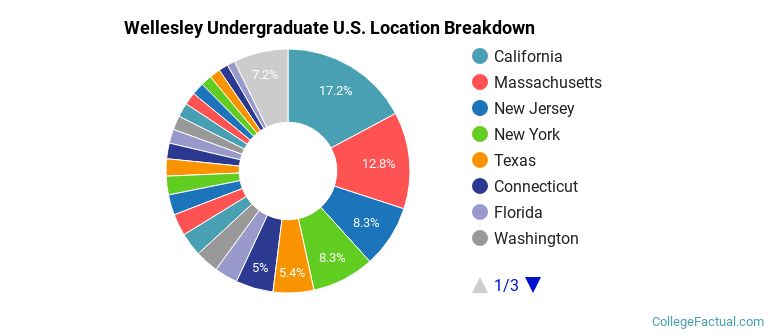
The undergraduate student body is split among 41 states (may include Washington D.C.). Click on the map for more detail.
| State | Amount |
|---|---|
| California | 83 |
| Massachusetts | 62 |
| New Jersey | 40 |
| New York | 40 |
| Texas | 26 |
Students from 54 countries are represented at this school, with the majority of the international students coming from China, India, and Canada.
Learn more about international students at Wellesley.
A traditional college student is defined as being between the ages of 18-21. At Wellesley, 90.03% of students fall into that category, compared to the national average of 60%.
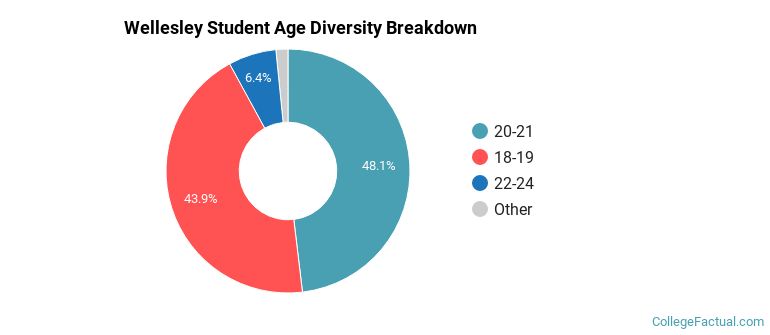
| Student Age Group | Amount |
|---|---|
| 20-21 | 1,180 |
| 18-19 | 1,078 |
| 22-24 | 156 |
| 25-29 | 20 |
| 35 and over | 10 |
| 30-34 | 9 |
| Under 18 | 0 |
Footnotes
*The racial-ethnic minorities count is calculated by taking the total number of students and subtracting white students, international students, and students whose race/ethnicity was unknown. This number is then divided by the total number of students at the school to obtain the racial-ethnic minorities percentage.
References
Department of Homeland Security Citizenship and Immigration Services
Image Credit: By Jared and Corin under License