Wesleyan U total enrollment is approximately 3,053 students. 2,836 are undergraduates and 134 are graduate students.
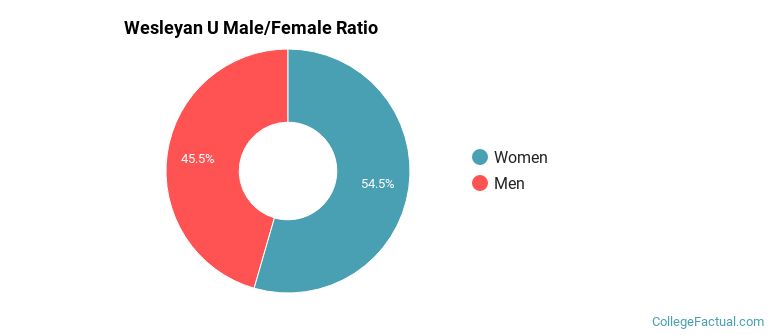
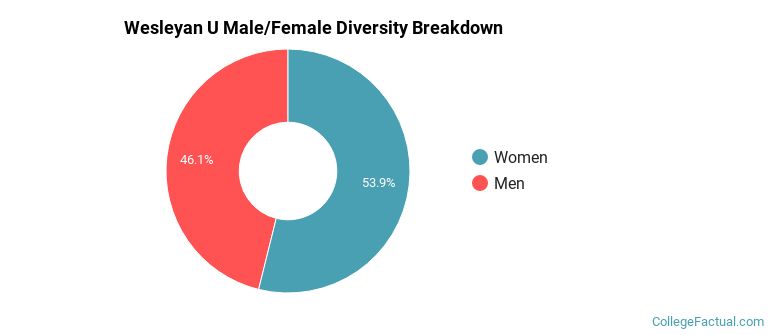
Male/Female Breakdown of Undergraduates
The full-time Wesleyan U undergraduate population is made up of 58% women, and 42% men.
For the gender breakdown for all students, go here.
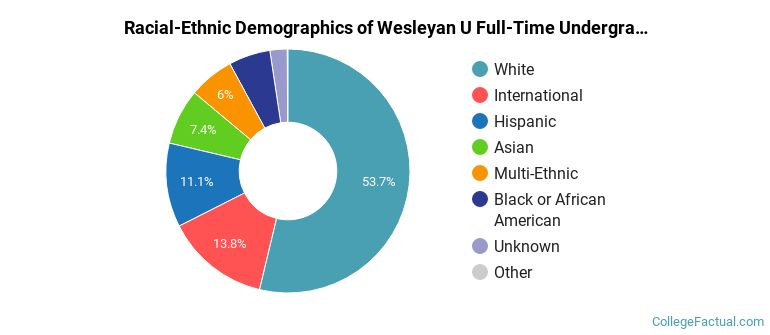
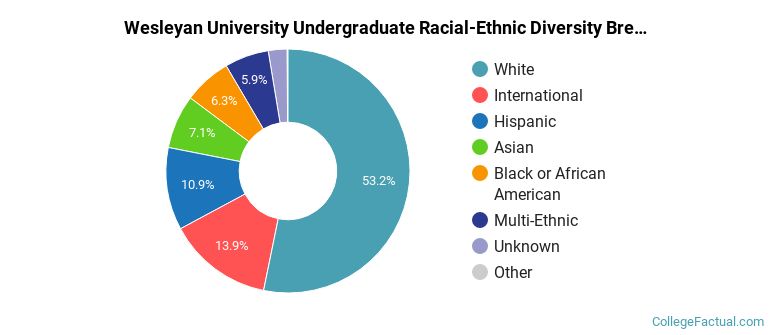
Wesleyan U Racial/Ethnic Breakdown of Undergraduates
| Race/Ethnicity | Number |
|---|---|
| White | 1,547 |
| Hispanic | 327 |
| International | 325 |
| Asian | 223 |
| Multi-Ethnic | 193 |
| Black or African American | 163 |
| Unknown | 55 |
| Native Hawaiian or Pacific Islander | 2 |
See racial/ethnic breakdown for all students.
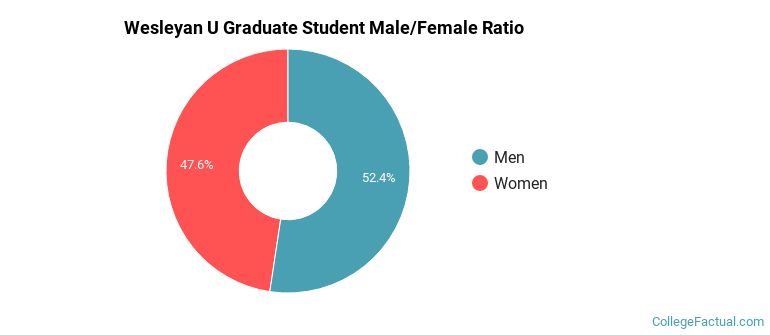
Male/Female Breakdown of Graduate Students
About 51% of full-time grad students are women, and 49% men.
For the gender breakdown for all students, go here.
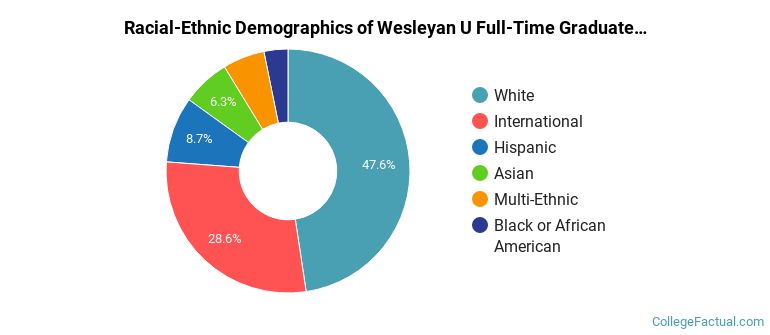
Wesleyan U Racial-Ethnic Breakdown of Graduate Students
| Race/Ethnicity | Number |
|---|---|
| White | 64 |
| International | 42 |
| Hispanic | 11 |
| Asian | 8 |
| Black or African American | 5 |
| Multi-Ethnic | 4 |
| Native Hawaiian or Pacific Islander | 0 |
| Unknown | 0 |
See racial/ethnic breakdown for all students.
| Race/Ethnicity | Number |
|---|---|
| White | 1,665 |
| International | 376 |
| Hispanic | 343 |
| Asian | 239 |
| Multi-Ethnic | 199 |
| Black or African American | 169 |
| Unknown | 59 |
| Native Hawaiian or Pacific Islander | 2 |
There are approximately 1,758 female students and 1,295 male students at Wesleyan U.
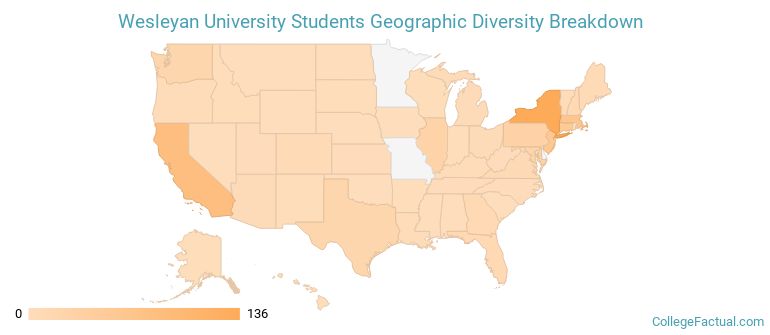
Wesleyan U ranks 36 out of 2,183 when it comes to geographic diversity.
91.65% of Wesleyan U students come from out of state, and 16.28% come from out of the country.
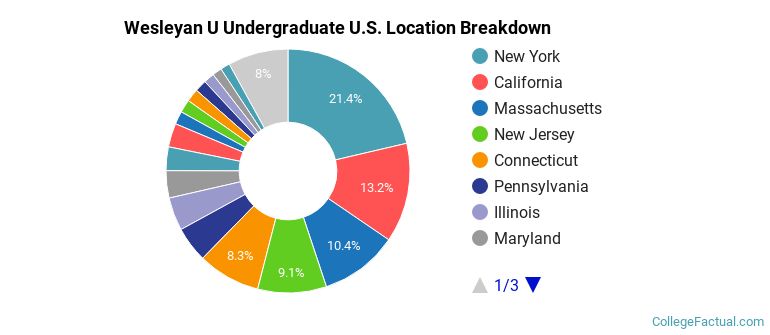
The undergraduate student body is split among 38 states (may include Washington D.C.). Click on the map for more detail.
| State | Amount |
|---|---|
| New York | 136 |
| California | 84 |
| Massachusetts | 66 |
| New Jersey | 58 |
| Connecticut | 53 |
Students from 64 countries are represented at this school, with the majority of the international students coming from China, India, and Canada.
Learn more about international students at Wesleyan U.
A traditional college student is defined as being between the ages of 18-21. At Wesleyan U, 82.07% of students fall into that category, compared to the national average of 60%.
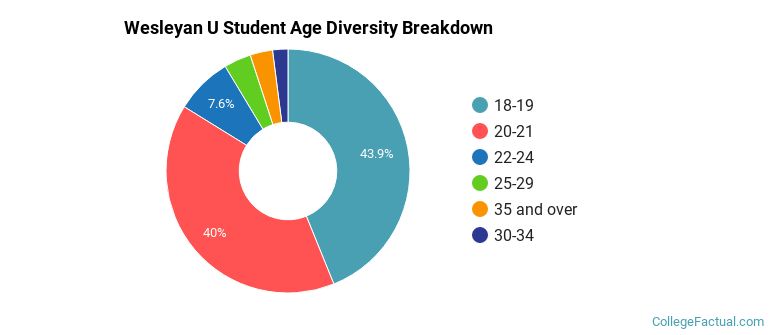
| Student Age Group | Amount |
|---|---|
| 18-19 | 1,380 |
| 20-21 | 1,257 |
| 22-24 | 238 |
| 25-29 | 113 |
| 35 and over | 94 |
| 30-34 | 64 |
| Under 18 | 0 |
Footnotes
*The racial-ethnic minorities count is calculated by taking the total number of students and subtracting white students, international students, and students whose race/ethnicity was unknown. This number is then divided by the total number of students at the school to obtain the racial-ethnic minorities percentage.
References
Department of Homeland Security Citizenship and Immigration Services
Image Credit: By Steadyjohn under License