WVSU total enrollment is approximately 3,638 students. 1,498 are undergraduates and 62 are graduate students.
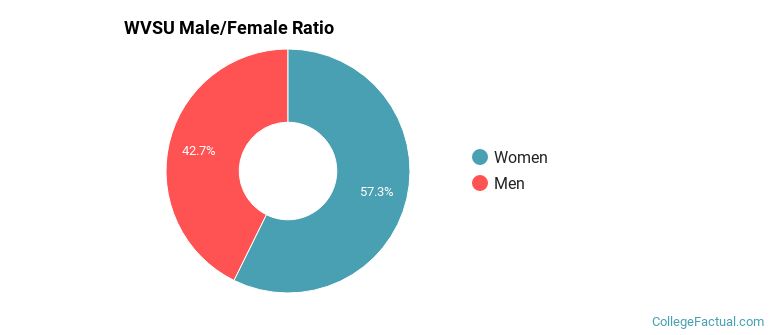
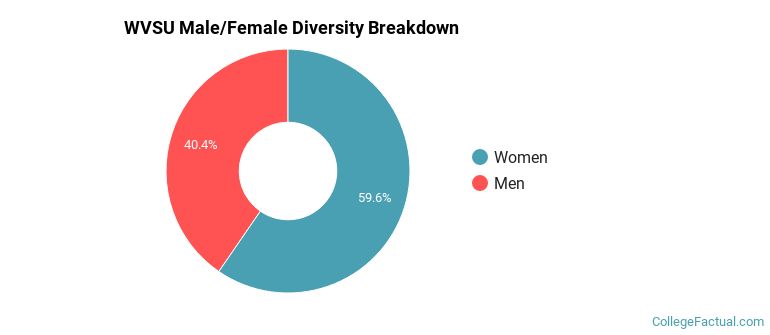
Male/Female Breakdown of Undergraduates
The full-time WVSU undergraduate population is made up of 55% women, and 45% men.
For the gender breakdown for all students, go here.
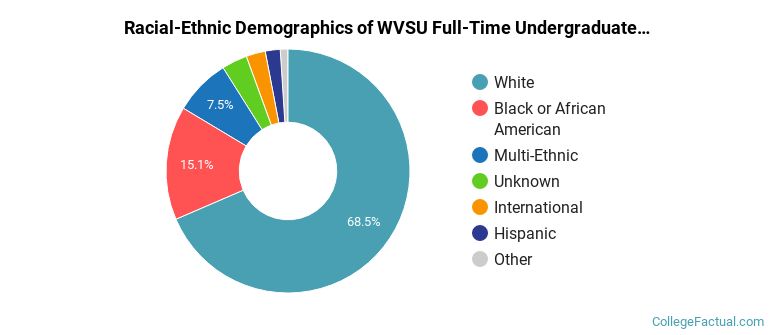
WVSU Racial/Ethnic Breakdown of Undergraduates
| Race/Ethnicity | Number |
|---|---|
| White | 957 |
| Black or African American | 226 |
| International | 114 |
| Multi-Ethnic | 86 |
| Unknown | 55 |
| Hispanic | 35 |
| Asian | 10 |
| Native Hawaiian or Pacific Islander | 3 |
See racial/ethnic breakdown for all students.
Male/Female Breakdown of Graduate Students
About 50% of full-time grad students are women, and 50% men.

For the gender breakdown for all students, go here.
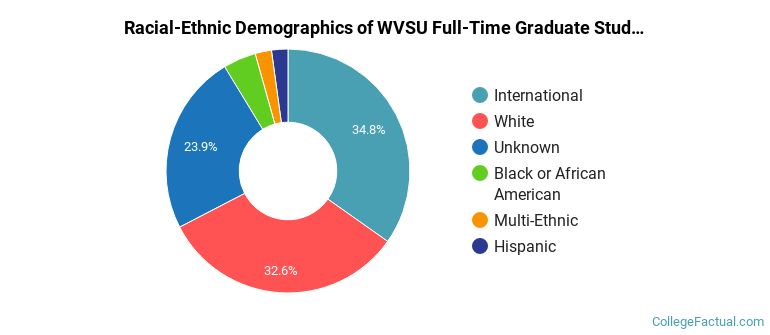
WVSU Racial-Ethnic Breakdown of Graduate Students
| Race/Ethnicity | Number |
|---|---|
| White | 16 |
| Unknown | 15 |
| Black or African American | 13 |
| Multi-Ethnic | 8 |
| International | 6 |
| Hispanic | 2 |
| Asian | 0 |
| Native Hawaiian or Pacific Islander | 0 |
See racial/ethnic breakdown for all students.
| Race/Ethnicity | Number |
|---|---|
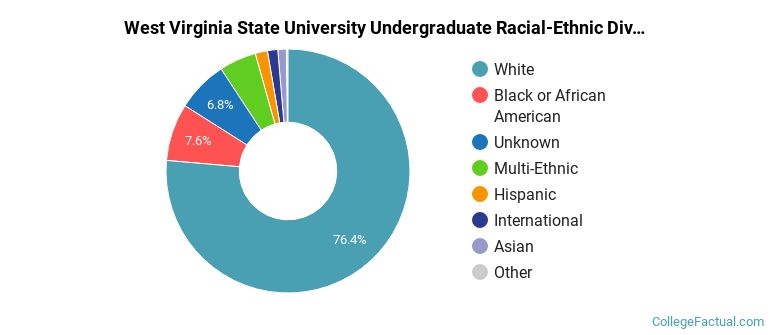
| White | 2,613 |
| Black or African American | 319 |
| International | 229 |
| Unknown | 190 |
| Multi-Ethnic | 161 |
| Hispanic | 64 |
| Asian | 36 |
| Native Hawaiian or Pacific Islander | 6 |
There are approximately 2,112 female students and 1,526 male students at WVSU.
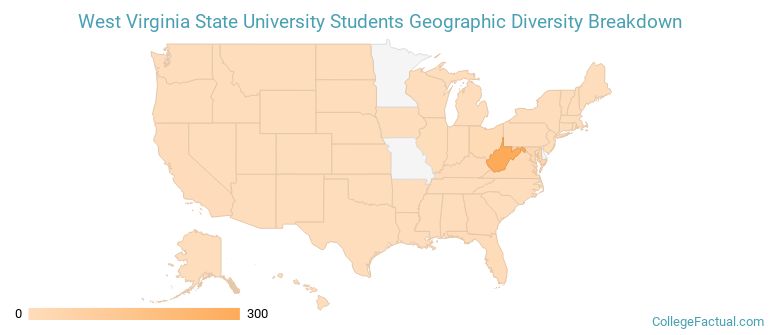
WVSU ranks 1,134 out of 2,183 when it comes to geographic diversity.
26.47% of WVSU students come from out of state, and 2.62% come from out of the country.
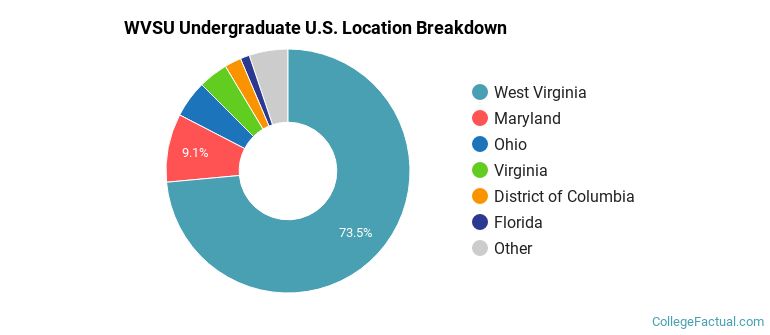
The undergraduate student body is split among 16 states (may include Washington D.C.). Click on the map for more detail.
| State | Amount |
|---|---|
| West Virginia | 300 |
| Maryland | 37 |
| Ohio | 20 |
| Virginia | 16 |
| District of Columbia | 9 |
Students from 29 countries are represented at this school, with the majority of the international students coming from Nepal, Mexico, and Brazil.
Learn more about international students at WVSU.
A traditional college student is defined as being between the ages of 18-21. At WVSU, 31.17% of students fall into that category, compared to the national average of 60%.
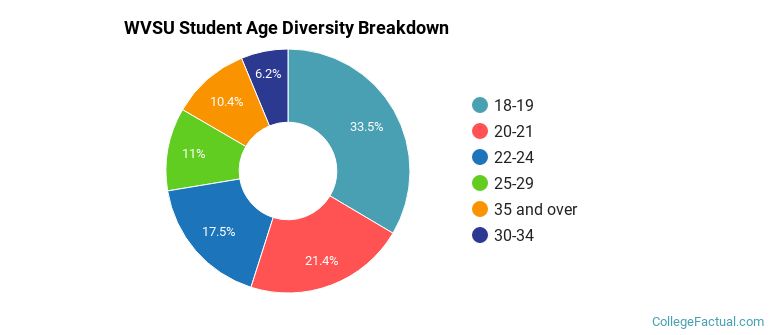
| Student Age Group | Amount |
|---|---|
| 18-19 | 738 |
| 20-21 | 471 |
| 22-24 | 385 |
| 25-29 | 242 |
| 35 and over | 229 |
| 30-34 | 137 |
| Under 18 | 0 |
Footnotes
*The racial-ethnic minorities count is calculated by taking the total number of students and subtracting white students, international students, and students whose race/ethnicity was unknown. This number is then divided by the total number of students at the school to obtain the racial-ethnic minorities percentage.
References
Department of Homeland Security Citizenship and Immigration Services
Image Credit: By Richinstead under License