WVU total enrollment is approximately 26,269 students. 18,726 are undergraduates and 4,216 are graduate students.
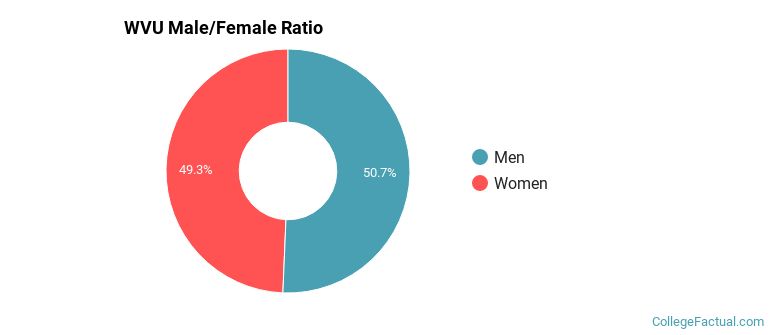
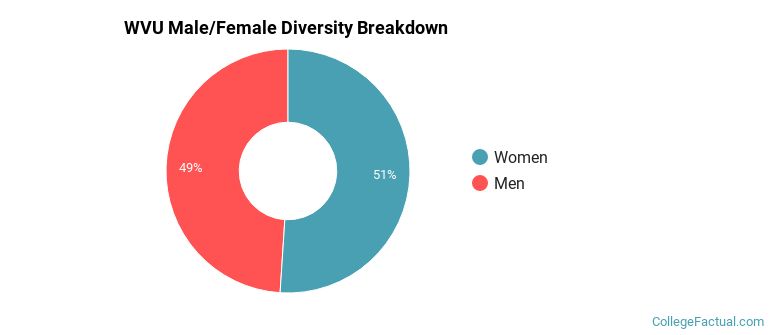
Male/Female Breakdown of Undergraduates
The full-time WVU undergraduate population is made up of 51% women, and 49% men.
For the gender breakdown for all students, go here.
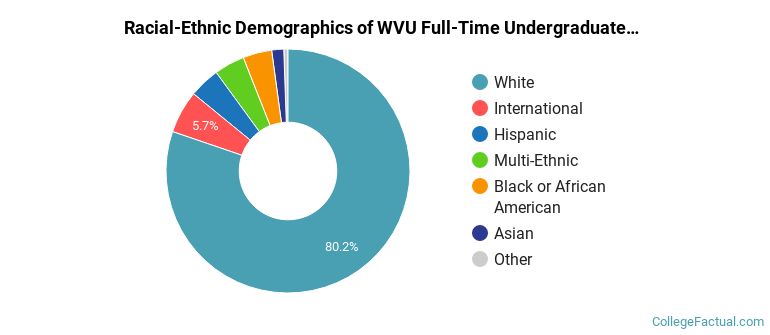
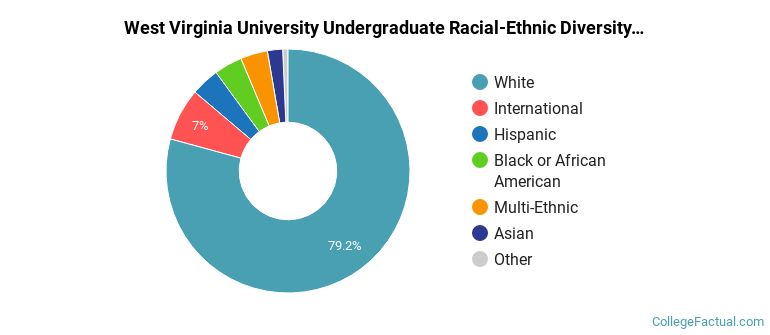
WVU Racial/Ethnic Breakdown of Undergraduates
| Race/Ethnicity | Number |
|---|---|
| White | 15,311 |
| Hispanic | 764 |
| Multi-Ethnic | 759 |
| International | 722 |
| Black or African American | 675 |
| Asian | 335 |
| Unknown | 119 |
| Native Hawaiian or Pacific Islander | 12 |
See racial/ethnic breakdown for all students.
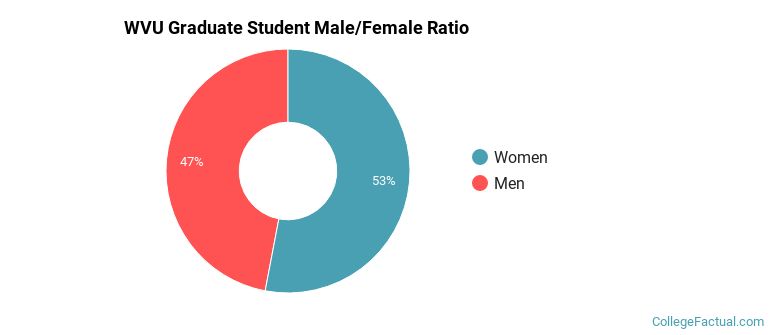
Male/Female Breakdown of Graduate Students
About 54% of full-time grad students are women, and 46% men.
For the gender breakdown for all students, go here.
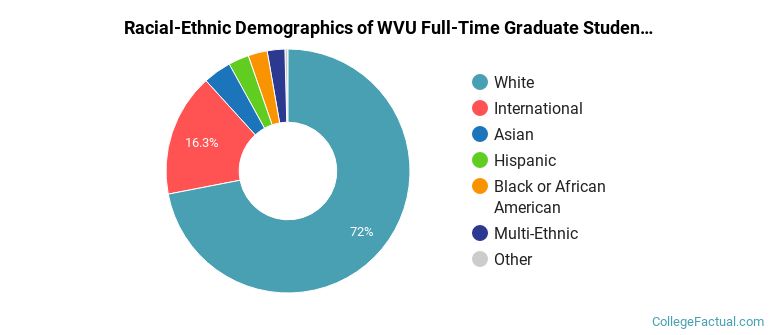
WVU Racial-Ethnic Breakdown of Graduate Students
| Race/Ethnicity | Number |
|---|---|
| White | 3,076 |
| International | 593 |
| Asian | 155 |
| Black or African American | 139 |
| Hispanic | 116 |
| Multi-Ethnic | 111 |
| Unknown | 21 |
| Native Hawaiian or Pacific Islander | 3 |
See racial/ethnic breakdown for all students.
| Race/Ethnicity | Number |
|---|---|
| White | 21,026 |
| International | 1,424 |
| Hispanic | 1,031 |
| Multi-Ethnic | 997 |
| Black or African American | 974 |
| Asian | 586 |
| Unknown | 175 |
| Native Hawaiian or Pacific Islander | 19 |
There are approximately 13,687 female students and 12,582 male students at WVU.
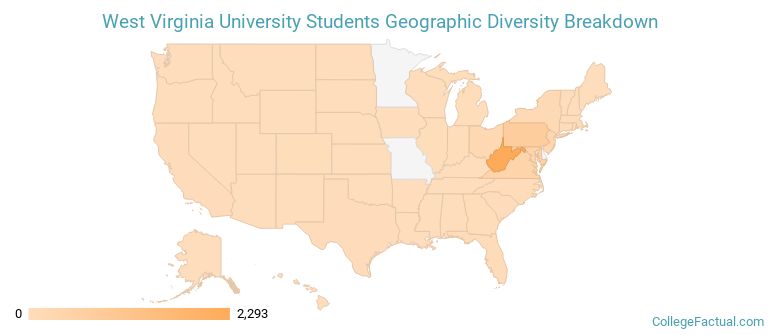
WVU ranks 315 out of 2,183 when it comes to geographic diversity.
53.89% of WVU students come from out of state, and 2.91% come from out of the country.
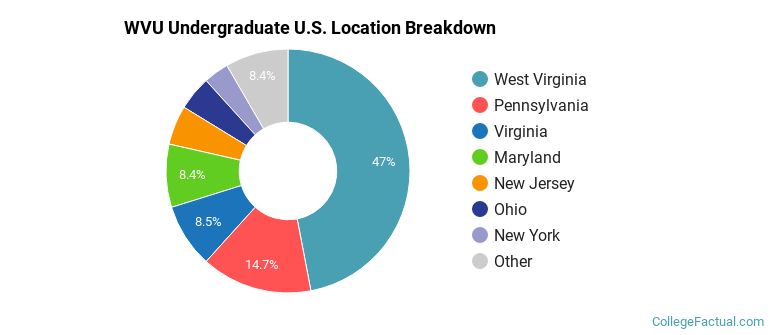
The undergraduate student body is split among 40 states (may include Washington D.C.). Click on the map for more detail.
| State | Amount |
|---|---|
| West Virginia | 2,293 |
| Pennsylvania | 718 |
| Virginia | 414 |
| Maryland | 408 |
| New Jersey | 254 |
Students from 112 countries are represented at this school, with the majority of the international students coming from Kuwait, Saudi Arabia, and China.
Learn more about international students at WVU.
A traditional college student is defined as being between the ages of 18-21. At WVU, 59.85% of students fall into that category, compared to the national average of 60%.
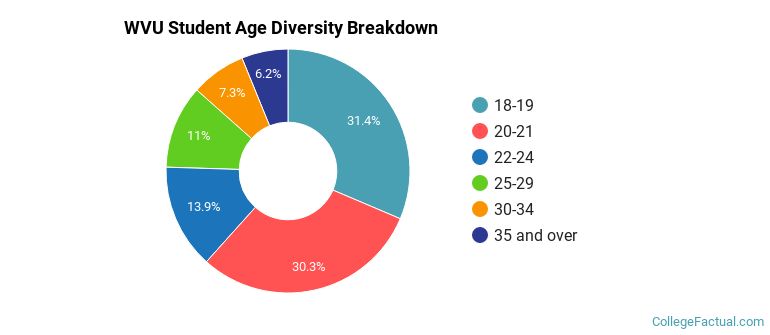
| Student Age Group | Amount |
|---|---|
| 18-19 | 8,658 |
| 20-21 | 8,342 |
| 22-24 | 3,820 |
| 25-29 | 3,047 |
| 30-34 | 2,011 |
| 35 and over | 1,698 |
| Under 18 | 0 |
Footnotes
*The racial-ethnic minorities count is calculated by taking the total number of students and subtracting white students, international students, and students whose race/ethnicity was unknown. This number is then divided by the total number of students at the school to obtain the racial-ethnic minorities percentage.
References
Department of Homeland Security Citizenship and Immigration Services
Image Credit: By Swimmerguy269 under License
Learn more about how College Factual creates their Diversity Rankings.