We've gathered data and other essential information about the program, such as the average salary of graduates, ethnicity of students, how many students graduated in recent times, and more. In addition, we cover how WGU ranks in comparison to other schools with subject specific ed programs.
Jump to any of the following sections:
In College Factual's most recent rankings for the best schools for subject specific ed majors, WGU came in at #20. This puts it in the top 5% of the country in this field of study. It is also ranked #1 in Utah.
During the 2021-2022 academic year, Western Governors University handed out 300 bachelor's degrees in teacher education subject specific. This is a decrease of 10% over the previous year when 334 degrees were handed out.
In 2022, 1,342 students received their master’s degree in subject specific ed from WGU. This makes it the #1 most popular school for subject specific ed master’s degree candidates in the country.
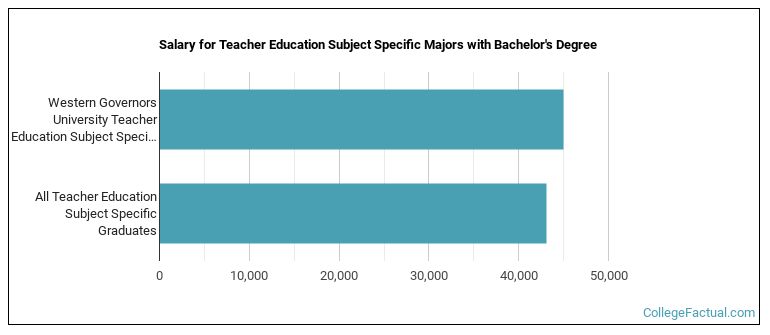
The median salary of subject specific ed students who receive their bachelor's degree at WGU is $44,958. This is great news for graduates of the program, since this figure is higher than the national average of $43,086 for all subject specific ed bachelor's degree recipients.
Information about average full-time undergraduate tuition and fees is shown in the table below.
| In State | Out of State | |
|---|---|---|
| Tuition | $7,710 | $7,710 |
| Fees | $590 | $590 |
| Books and Supplies | $200 | $200 |
Learn more about WGU tuition and fees.
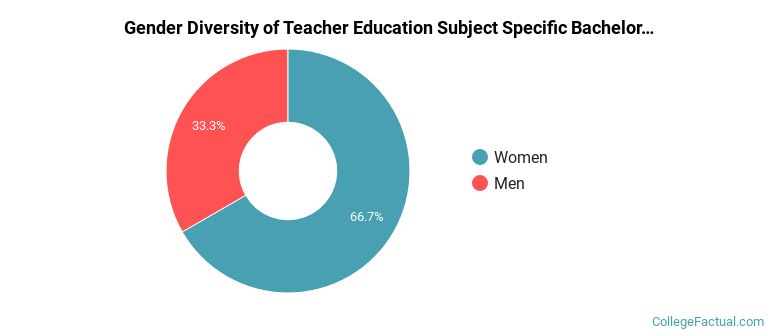
Of the 300 students who earned a bachelor's degree in Teacher Education Subject Specific from WGU in 2021-2022, 33% were men and 67% were women.
The majority of bachelor's degree recipients in this major at WGU are white. In the most recent graduating class for which data is available, 76% of students fell into this category.
The following table and chart show the ethnic background for students who recently graduated from Western Governors University with a bachelor's in subject specific ed.
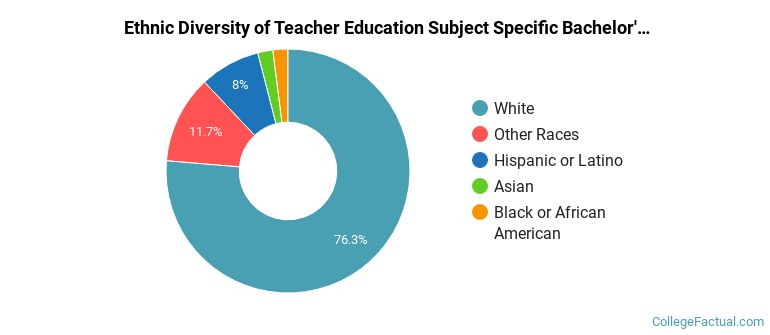
| Ethnic Background | Number of Students |
|---|---|
| Asian | 6 |
| Black or African American | 6 |
| Hispanic or Latino | 24 |
| White | 229 |
| Non-Resident Aliens | 0 |
| Other Races | 35 |
WGU does not offer an online option for its subject specific ed bachelor’s degree program at this time. To see if the school offers distance learning options in other areas, visit the WGU Online Learning page.
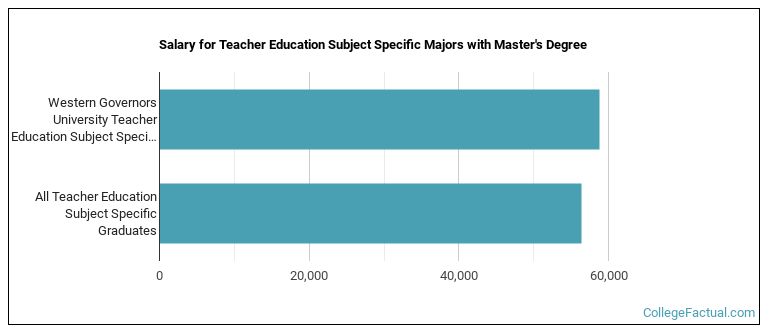
Graduates of the master's subject specific ed program at WGU make a median salary of $58,818. This is a better than average outcome since the median salary for all subject specific ed graduates with a master's is $56,457.
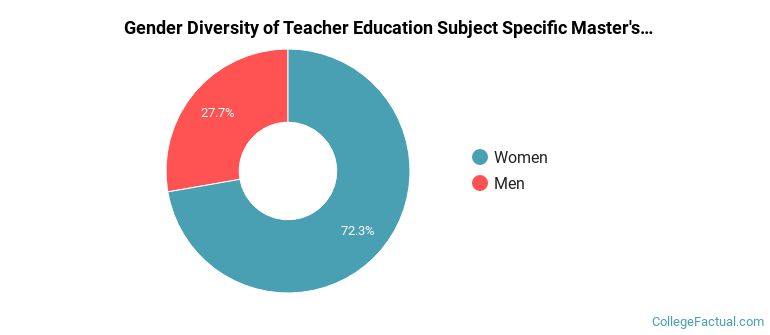
Of the 1,240 subject specific ed students who graduated with a master's degree in 2021-2022 from WGU, about 28% were men and 72% were women.
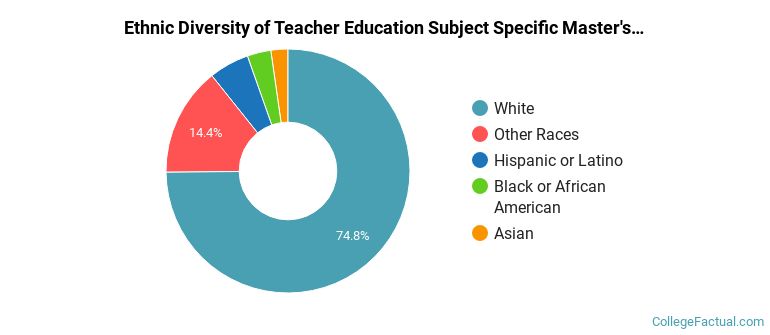
The majority of master's degree recipients in this major at WGU are white. In the most recent graduating class for which data is available, 75% of students fell into this category.
The following table and chart show the ethnic background for students who recently graduated from Western Governors University with a master's in subject specific ed.
| Ethnic Background | Number of Students |
|---|---|
| Asian | 28 |
| Black or African American | 39 |
| Hispanic or Latino | 66 |
| White | 928 |
| Non-Resident Aliens | 0 |
| Other Races | 179 |
Take a look at the following statistics related to the make-up of the subject specific ed majors at Western Governors University.
| Related Major | Annual Graduates |
|---|---|
| Teacher Education Grade Specific | 2,826 |
| Curriculum & Instruction | 2,461 |
| Instructional Media Design | 1,962 |
| Educational Assessment | 1,843 |
| Special Education | 924 |
View All Teacher Education Subject Specific Related Majors >