WGU total enrollment is approximately 147,866 students. 104,919 are undergraduates and 42,947 are graduate students.
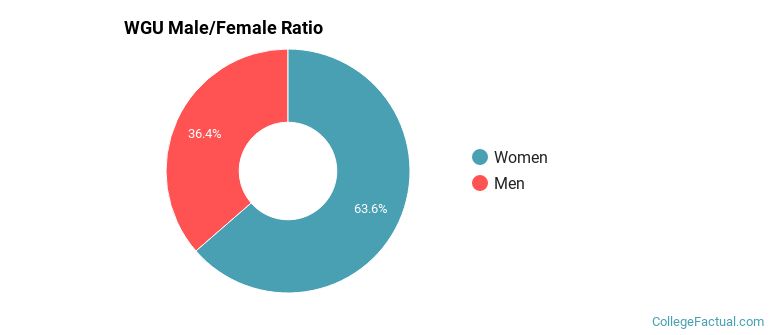
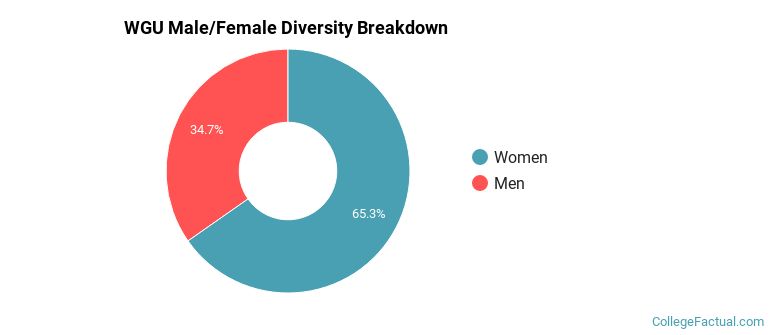
Male/Female Breakdown of Undergraduates
The full-time WGU undergraduate population is made up of 63% women, and 37% men.
For the gender breakdown for all students, go here.
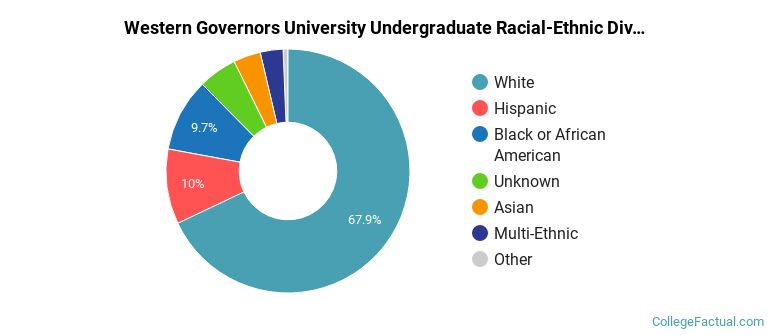
WGU Racial/Ethnic Breakdown of Undergraduates
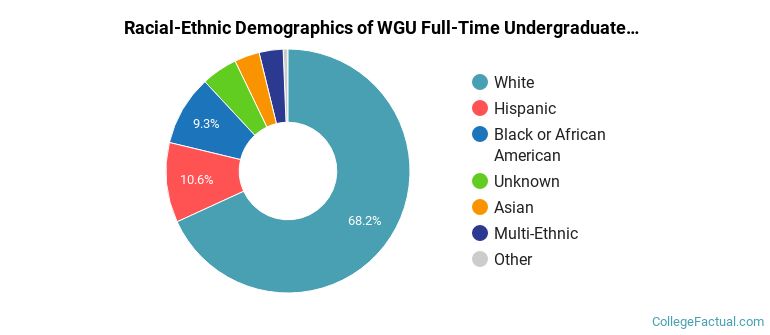
| Race/Ethnicity | Number |
|---|---|
| White | 63,686 |
| Unknown | 11,808 |
| Hispanic | 11,484 |
| Black or African American | 9,971 |
| Asian | 3,562 |
| Multi-Ethnic | 2,927 |
| Native Hawaiian or Pacific Islander | 601 |
| International | 89 |
See racial/ethnic breakdown for all students.
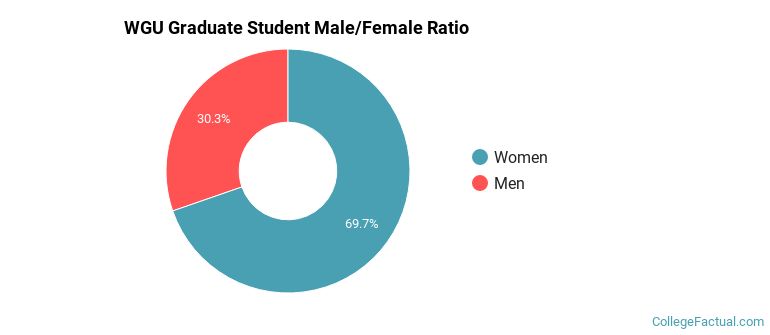
Male/Female Breakdown of Graduate Students
About 71% of full-time grad students are women, and 29% men.
For the gender breakdown for all students, go here.
WGU Racial-Ethnic Breakdown of Graduate Students
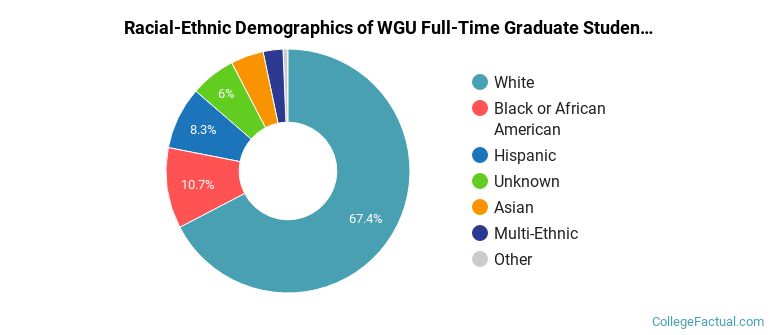
| Race/Ethnicity | Number |
|---|---|
| White | 25,742 |
| Unknown | 6,037 |
| Black or African American | 4,250 |
| Hispanic | 3,530 |
| Asian | 1,878 |
| Multi-Ethnic | 935 |
| Native Hawaiian or Pacific Islander | 227 |
| International | 37 |
See racial/ethnic breakdown for all students.
| Race/Ethnicity | Number |
|---|---|
| White | 89,428 |
| Unknown | 17,845 |
| Hispanic | 15,014 |
| Black or African American | 14,221 |
| Asian | 5,440 |
| Multi-Ethnic | 3,862 |
| Native Hawaiian or Pacific Islander | 828 |
| International | 126 |
There are approximately 96,478 female students and 51,388 male students at WGU.
Learn more about international students at WGU.
A traditional college student is defined as being between the ages of 18-21. At WGU, 1.40% of students fall into that category, compared to the national average of 60%.
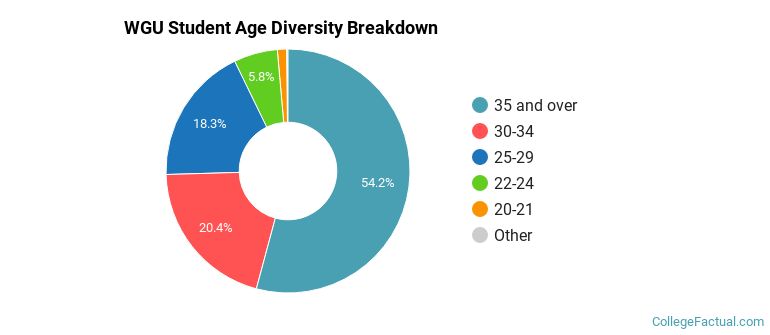
| Student Age Group | Amount |
|---|---|
| 35 and over | 53,330 |
| 30-34 | 20,045 |
| 25-29 | 17,973 |
| 22-24 | 5,707 |
| 20-21 | 1,202 |
| 18-19 | 180 |
| Under 18 | 0 |
Footnotes
*The racial-ethnic minorities count is calculated by taking the total number of students and subtracting white students, international students, and students whose race/ethnicity was unknown. This number is then divided by the total number of students at the school to obtain the racial-ethnic minorities percentage.
References