WKU total enrollment is approximately 17,517 students. 11,749 are undergraduates and 829 are graduate students.
Male/Female Breakdown of Undergraduates
The full-time WKU undergraduate population is made up of 60% women, and 40% men.

For the gender breakdown for all students, go here.
WKU Racial/Ethnic Breakdown of Undergraduates
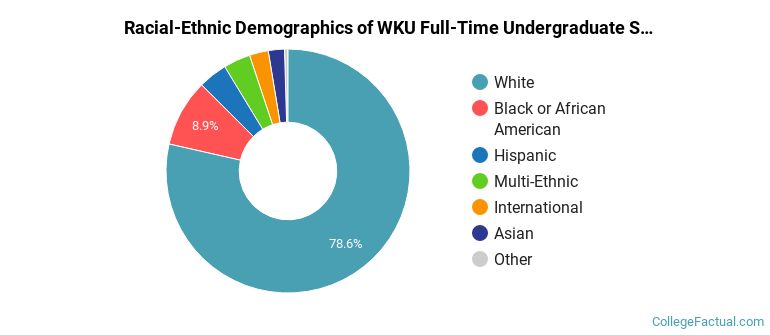
| Race/Ethnicity | Number |
|---|---|
| White | 9,135 |
| Black or African American | 1,093 |
| Hispanic | 509 |
| Multi-Ethnic | 461 |
| Asian | 292 |
| International | 184 |
| Unknown | 41 |
| Native Hawaiian or Pacific Islander | 14 |
See racial/ethnic breakdown for all students.
Male/Female Breakdown of Graduate Students
About 69% of full-time grad students are women, and 31% men.
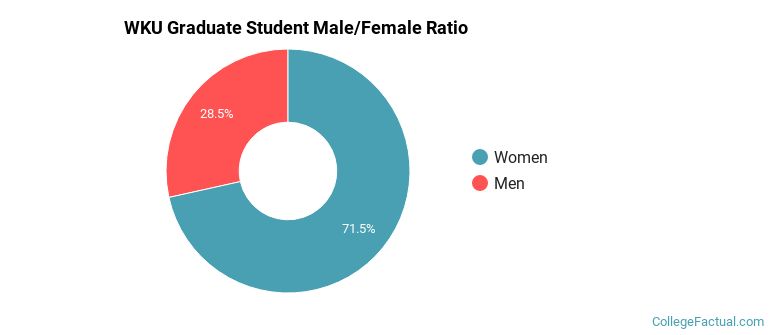
For the gender breakdown for all students, go here.
WKU Racial-Ethnic Breakdown of Graduate Students
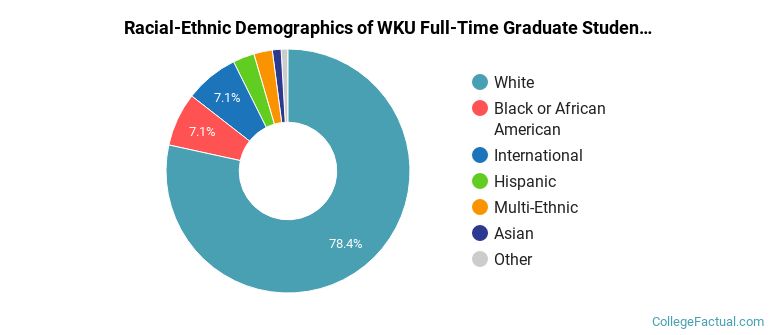
| Race/Ethnicity | Number |
|---|---|
| White | 653 |
| Black or African American | 71 |
| International | 34 |
| Hispanic | 28 |
| Multi-Ethnic | 21 |
| Asian | 11 |
| Unknown | 10 |
| Native Hawaiian or Pacific Islander | 0 |
See racial/ethnic breakdown for all students.
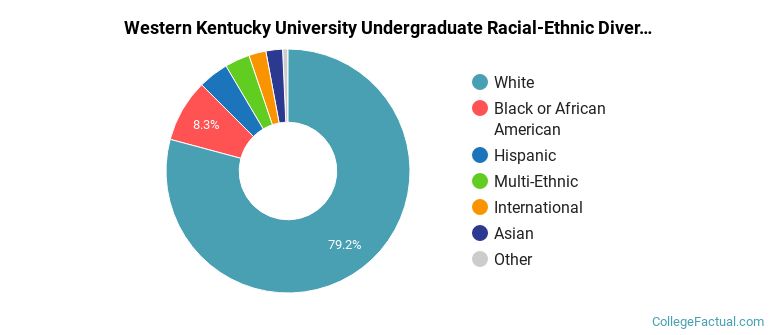
| Race/Ethnicity | Number |
|---|---|
| White | 13,723 |
| Black or African American | 1,557 |
| Hispanic | 771 |
| Multi-Ethnic | 619 |
| Asian | 427 |
| International | 258 |
| Unknown | 101 |
| Native Hawaiian or Pacific Islander | 28 |
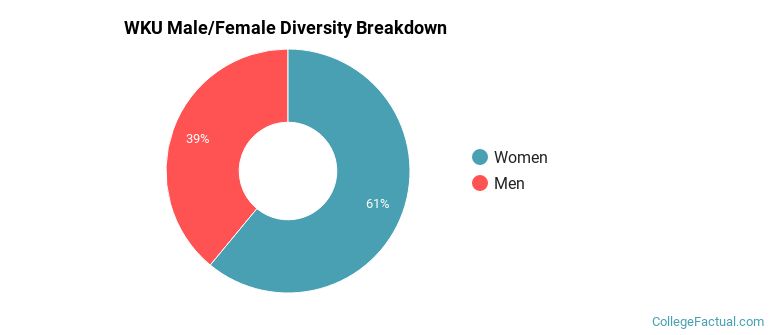
There are approximately 10,793 female students and 6,724 male students at WKU.
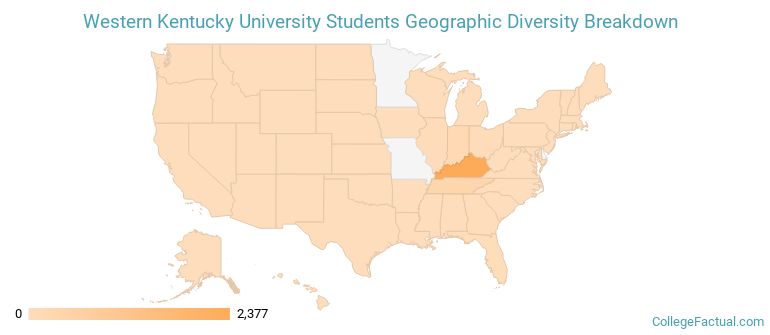
WKU ranks 908 out of 2,183 when it comes to geographic diversity.
23.98% of WKU students come from out of state, and 2.04% come from out of the country.

The undergraduate student body is split among 28 states (may include Washington D.C.). Click on the map for more detail.
| State | Amount |
|---|---|
| Kentucky | 2,377 |
| Tennessee | 338 |
| Indiana | 199 |
| Illinois | 66 |
| Ohio | 37 |
Students from 86 countries are represented at this school, with the majority of the international students coming from Saudi Arabia, China, and India.
Learn more about international students at WKU.
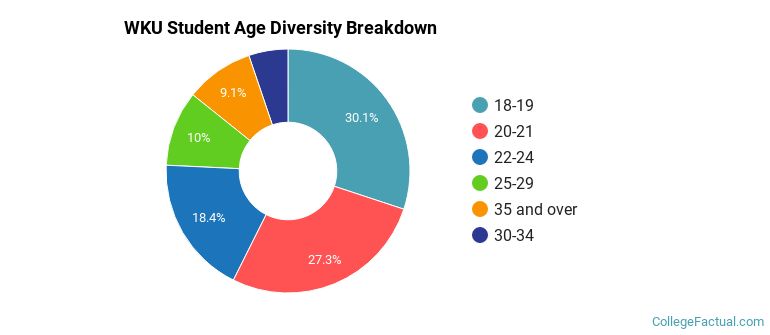
A traditional college student is defined as being between the ages of 18-21. At WKU, 49.38% of students fall into that category, compared to the national average of 60%.
| Student Age Group | Amount |
|---|---|
| 18-19 | 5,242 |
| 20-21 | 4,761 |
| 22-24 | 3,202 |
| 25-29 | 1,741 |
| 35 and over | 1,578 |
| 30-34 | 907 |
| Under 18 | 0 |
Footnotes
*The racial-ethnic minorities count is calculated by taking the total number of students and subtracting white students, international students, and students whose race/ethnicity was unknown. This number is then divided by the total number of students at the school to obtain the racial-ethnic minorities percentage.
References
Department of Homeland Security Citizenship and Immigration Services
Learn more about how College Factual creates their Diversity Rankings.