Here is an overview of this program at WMU. Degrees are awarded at the Bachelor’s level, with graduate study also available. At its best it places at #8 out of 18 schools (Bachelor’s level) by College Factual. Jump to any of the following sections:
By College Factual’s measure, WMU highly for teacher education subject specific, coming in at #367 out of 554 schools nationally.
| Ranking | Rank |
|---|---|
| Best Teacher Education Subject Specific Schools | 367 of 554 |
| Best Teacher Education Subject Specific Schools in Michigan | 10 of 19 |
| Best Teacher Education Subject Specific Schools in the Great Lakes Region | 68 of 100 |
The table below lists every degree level available for teacher education subject specific at WMU, along with how many graduates complete each level annually.
| Degree Level | Annual Graduates |
|---|---|
| Bachelor’s | 116 |
| Master’s | 34 |
| Doctoral | 4 |
For the most recent IPEDS reporting year, Western Michigan University awarded 116 bachelor’s degrees in teacher education subject specific.
WMU is among the very best schools in the country for teacher education subject specific at the bachelor’s level. Its best result was #8 out of 18 schools by College Factual.
Teacher Education Subject Specific majors who earn their bachelor’s degree from WMU report a median salary of $47,295 a year. This is lower than $58,084, the median for all majors at WMU.
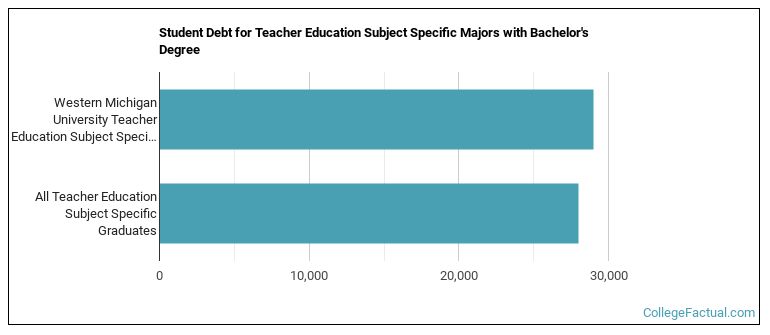
Earning a bachelor’s degree at WMU, teacher education subject specific students borrow a median amount of $29,000 in student loans. This is higher than $27,999, the typical median for all majors at WMU.
Information about average full-time undergraduate tuition and fees is shown in the table below.
| In State | Out of State | |
|---|---|---|
| Tuition | $13,334 | $19,826 |
| Fees | $126 | $126 |
Find out more about WMU tuition and fees.
For the most recent academic year available, 35% of teacher education subject specific bachelor’s degrees went to men and 65% went to women.
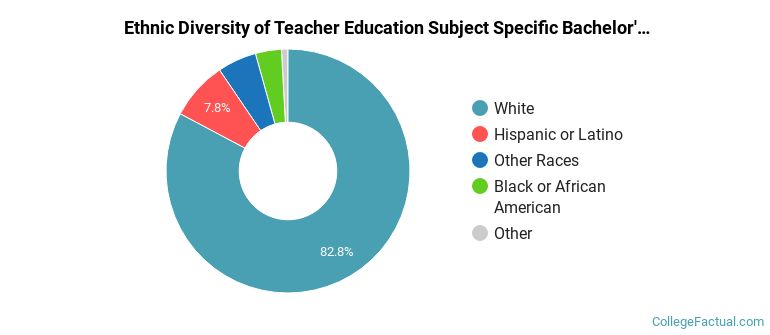
 The largest share of teacher education subject specific bachelor’s degree graduates at WMU were White. Roughly 83% of graduates fell into this category.
The following table and chart show the ethnic background for students who recently graduated from Western Michigan University with a bachelor’s in teacher education subject specific.
| Ethnic Background | Number of Students |
|---|---|
| Asian | 1 |
| Black or African American | 4 |
| Hispanic or Latino | 9 |
| White | 96 |
| Non-Resident Aliens | 0 |
| Other Races | 6 |
WMU conferred 28 bachelor’s degrees in social studies teacher education in the most recent reporting year — 54% to women and 46% to men. Most of these graduates identified as White (89%).
WMU conferred 25 bachelor’s degrees in music teacher education recently — 60% to women and 40% to men. The largest share of these graduates were White (84%).
WMU granted 17 bachelor’s degrees in english/language arts teacher education in the most recent reporting year — 94% to women and 6% to men. The most common background among these graduates was White (59%).
WMU granted 14 bachelor’s degrees in mathematics teacher education recently — 71% to women and 29% to men. Most of these graduates identified as White (79%).
WMU granted 10 bachelor’s degrees in teacher education and professional development, specific subject areas, other recently — 40% to women and 60% to men. Most of these graduates identified as White (100%).
WMU awarded 7 bachelor’s degrees in science teacher education/general science teacher education in the most recent reporting year — 86% to women and 14% to men. The most common background among these graduates was White (71%).
WMU awarded 5 bachelor’s degrees in art teacher education in the latest year of data — 80% to women and 20% to men. The largest share of these graduates were White (80%).
WMU conferred 3 bachelor’s completions in business and innovation/entrepreneurship teacher education in the latest year of data — 33% to women and 67% to men. The most common background among these graduates was White (100%).
WMU granted 2 bachelor’s completions in family and consumer sciences/home economics teacher education in the most recent reporting year — 100% to women and 0% to men. The most common background among these graduates was White (100%).
WMU awarded 2 bachelor’s degrees in spanish language teacher education in the latest year of data — 50% to women and 50% to men. The most common background among these graduates was White (100%).
WMU granted 1 bachelor’s completion in history teacher education recently — 0% to women and 100% to men. The largest share of these graduates were White (100%).
WMU awarded 1 bachelor’s degree in technology teacher education/industrial arts teacher education in the most recent reporting year — 100% to women and 0% to men. Most of these graduates identified as White (100%).
WMU granted 1 bachelor’s degree in trade and industrial teacher education in the latest year of data — 0% to women and 100% to men. The largest share of these graduates were White (100%).
This program is also offered at the graduate level at WMU. Here are the graduate award levels offered.
| Graduate Level | Annual Graduates |
|---|---|
| Master’s Degrees in Teacher Education Subject Specific | 34 |
| Doctoral Degrees in Teacher Education Subject Specific | 4 |
