We've pulled together some essential information you should know about the program, including how many students graduate each year, the ethnic diversity of these students, average starting salaries, and more. We've also included details on how WMU ranks compared to other colleges offering a major in clinical psychology.
Go directly to any of the following sections:
WMU was ranked #56 on College Factual's most recent list of the best schools for clinical psychology majors. This puts the bachelor's program at the school solidly in the top 15% of all colleges and universities in the country. It is also ranked #2 in Michigan.
During the 2021-2022 academic year, Western Michigan University handed out 70 bachelor's degrees in clinical, counseling & applied psychology. This is an increase of 23% over the previous year when 57 degrees were handed out.
In 2022, 72 students received their master’s degree in clinical psychology from WMU. This makes it the #65 most popular school for clinical psychology master’s degree candidates in the country.
In addition, 21 students received their doctoral degrees in clinical psychology in 2022, making the school the #55 most popular school in the United States for this category of students.
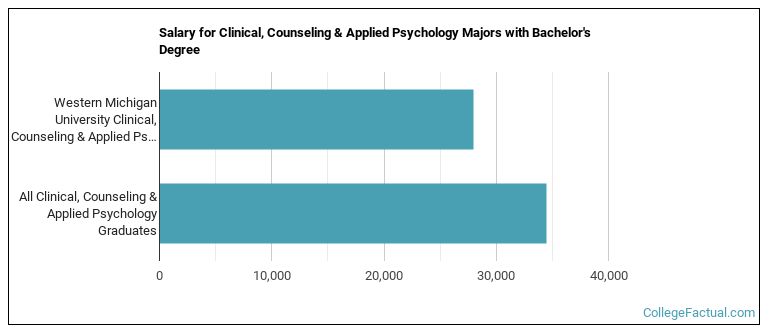
The median salary of clinical psychology students who receive their bachelor's degree at WMU is $28,007. This is less than $34,491, which is the national median of all clinical psychology majors in the nation who earn bachelor's degrees.
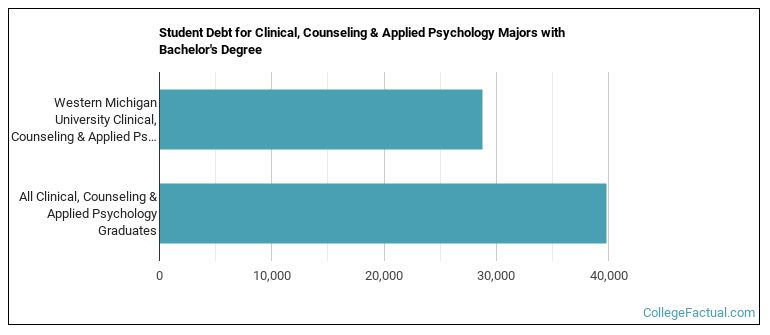
While getting their bachelor's degree at WMU, clinical psychology students borrow a median amount of $28,750 in student loans. This is not too bad considering that the median debt load of all clinical psychology bachelor's degree recipients across the country is $39,804.
In 2022-2023, the average part-time undergraduate tuition at WMU was $792 per credit hour for out-of-state students. The average for in-state students was $633 per credit hour. Information about average full-time undergraduate tuition and fees is shown in the table below.
| In State | Out of State | |
|---|---|---|
| Tuition | $15,198 | $18,998 |
| Fees | $100 | $100 |
| Books and Supplies | $1,128 | $1,128 |
| On Campus Room and Board | $11,713 | $11,713 |
| On Campus Other Expenses | $2,631 | $2,631 |
Learn more about WMU tuition and fees.
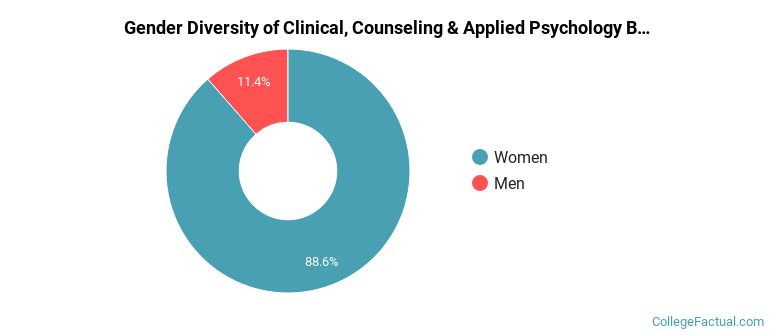
For the most recent academic year available, 11% of clinical psychology bachelor's degrees went to men and 89% went to women.
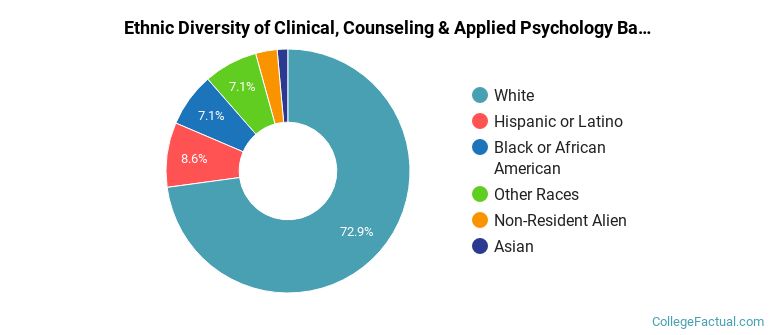
The majority of bachelor's degree recipients in this major at WMU are white. In the most recent graduating class for which data is available, 73% of students fell into this category.
The following table and chart show the ethnic background for students who recently graduated from Western Michigan University with a bachelor's in clinical psychology.
| Ethnic Background | Number of Students |
|---|---|
| Asian | 1 |
| Black or African American | 5 |
| Hispanic or Latino | 6 |
| White | 51 |
| Non-Resident Aliens | 2 |
| Other Races | 5 |
WMU does not offer an online option for its clinical psychology bachelor’s degree program at this time. To see if the school offers distance learning options in other areas, visit the WMU Online Learning page.
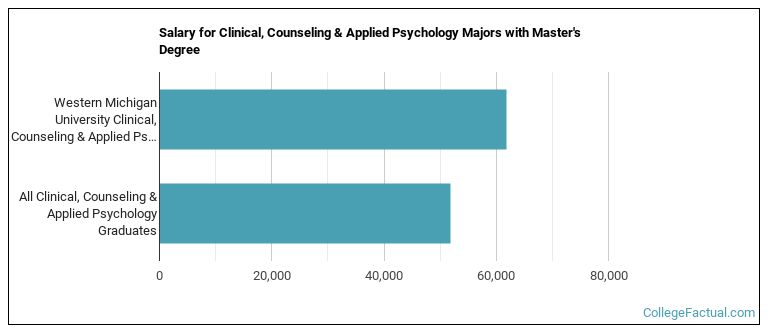
Clinical Psychology majors graduating with a master's degree from WMU make a median salary of $61,846 a year. This is a better than average outcome since the median salary for all clinical psychology graduates with a master's is $51,772.
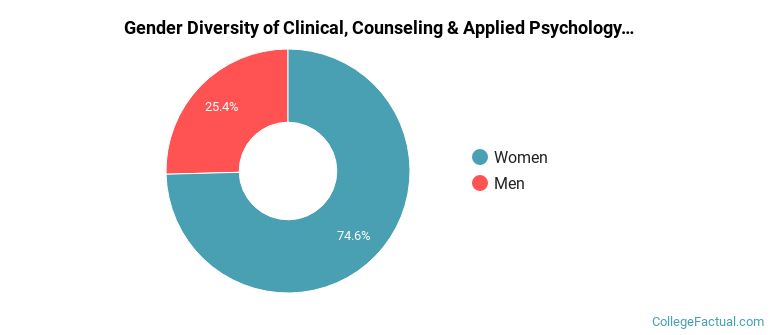
In the 2021-2022 academic year, 59 students earned a master's degree in clinical psychology from WMU. About 75% of these graduates were women and the other 25% were men.
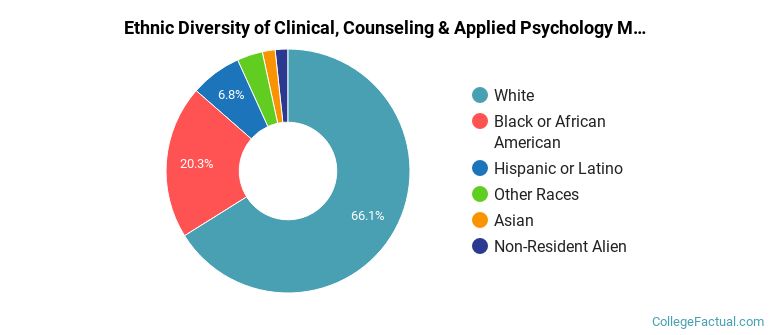
The majority of master's degree recipients in this major at WMU are white. In the most recent graduating class for which data is available, 66% of students fell into this category.
The following table and chart show the ethnic background for students who recently graduated from Western Michigan University with a master's in clinical psychology.
| Ethnic Background | Number of Students |
|---|---|
| Asian | 1 |
| Black or African American | 12 |
| Hispanic or Latino | 4 |
| White | 39 |
| Non-Resident Aliens | 1 |
| Other Races | 2 |
Take a look at the following statistics related to the make-up of the clinical psychology majors at Western Michigan University.
| Related Major | Annual Graduates |
|---|---|
| General Psychology | 117 |
| Child Development & Psychology | 2 |
View All Clinical, Counseling & Applied Psychology Related Majors >
More about our data sources and methodologies.