Below are the key facts about this program at WMU. It is offered at the Bachelor’s level, with graduate study also available. At its best it places at #4 out of 7 schools (Bachelor’s level) by College Factual. Jump to any of the following sections:
College Factual rates WMU highly for music, ranked #222 out of 416 schools nationally.
| Ranking | Rank |
|---|---|
| Best Music Schools | 222 of 416 |
| Best Music Schools in Michigan | 3 of 8 |
| Best Music Schools in the Great Lakes Region | 27 of 51 |
Here is each degree level granted in music at WMU, along with how many graduates complete each level annually.
| Degree Level | Annual Graduates |
|---|---|
| Bachelor’s | 42 |
| Master’s | 24 |
During the most recent reporting year, Western Michigan University conferred 42 bachelor’s degrees in music.
WMU is a solid choice among schools offering music at the bachelor’s level. Its best result was #4 out of 7 schools by College Factual.
| Ranking | Rank |
|---|---|
| Best Music Bachelor’s Degree Schools in Michigan | 4 |
| Best Music Bachelor’s Degree Schools in the Great Lakes Region | 32 |
| Best Music Bachelor’s Degree Schools | 232 |
Music majors who earn their bachelor’s degree from WMU earn a median of $37,801 a year. This is lower than $58,084, the median for all majors at WMU.
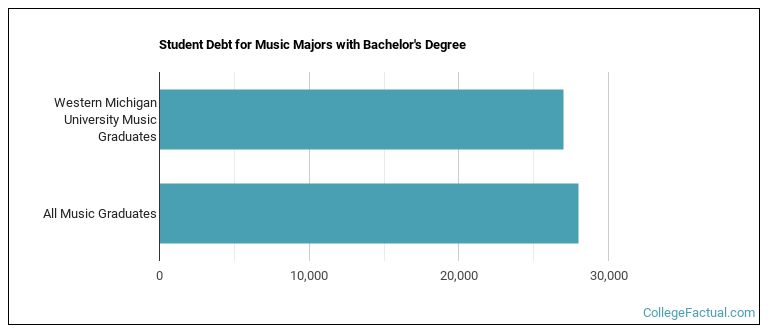
While getting their bachelor’s degree at WMU, music students accumulate a median of $27,000 in student loans. This is below $27,999, the typical median for all majors at WMU.
Information about average full-time undergraduate tuition and fees is shown in the table below.
| In State | Out of State | |
|---|---|---|
| Tuition | $13,334 | $19,826 |
| Fees | $126 | $126 |
Read more about WMU tuition and fees.
In the most recent graduating class, 55% of music bachelor’s degrees went to men and 45% went to women.
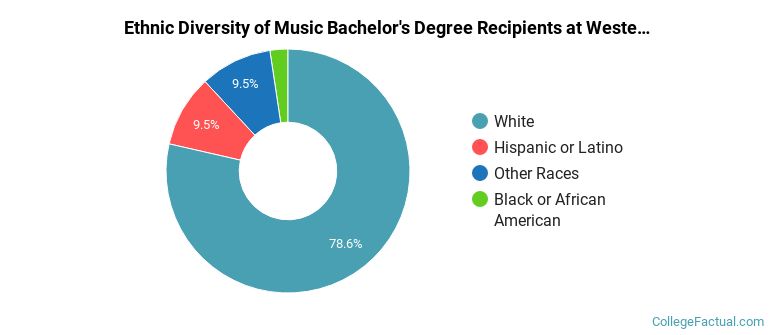
 The majority of music bachelor’s degree graduates at WMU were White. Roughly 79% of graduates fell into this category.
The following table and chart show the ethnic background for students who recently graduated from Western Michigan University with a bachelor’s in music.
| Ethnic Background | Number of Students |
|---|---|
| Asian | 0 |
| Black or African American | 1 |
| Hispanic or Latino | 4 |
| White | 33 |
| Non-Resident Aliens | 0 |
| Other Races | 4 |
WMU granted 13 bachelor’s completions in music performance, general recently — 77% to women and 23% to men. The most common background among these graduates was White (69%).
WMU granted 11 bachelor’s degrees in music technology recently — 9% to women and 91% to men. The largest share of these graduates were White (64%).
WMU awarded 5 bachelor’s completions in voice and opera in the most recent reporting year — 80% to women and 20% to men. Most of these graduates identified as White (100%).
WMU conferred 4 bachelor’s completions in jazz/jazz studies in the most recent reporting year — 0% to women and 100% to men. Most of these graduates identified as White (100%).
WMU awarded 3 bachelor’s degrees in music theory and composition in the latest year of data — 0% to women and 100% to men. The most common background among these graduates was White (67%).
This program is also offered at the graduate level at WMU. Annual graduate completions by level are shown below.
| Graduate Level | Annual Graduates |
|---|---|
| Master’s Degrees in Music | 24 |
