Here is an overview of this program at Western Wisconsin Technical College. It is offered at the Associate’s level. Its best result is a rank of #4 out of 7 schools (Associate’s level) by College Factual. Jump to any of the following sections:
College Factual rates Western Wisconsin Technical College as a strong choice for design & applied arts, coming in at #230 out of 558 schools nationally.
| Ranking | Rank |
|---|---|
| Best Design & Applied Arts Schools | 230 of 558 |
| Best Design & Applied Arts Schools in Wisconsin | 8 of 15 |
| Best Design & Applied Arts Schools in the Great Lakes Region | 37 of 77 |
The following degree levels are offered in design & applied arts at Western Wisconsin Technical College, along with how many graduates complete each level annually.
| Degree Level | Annual Graduates |
|---|---|
| Associate’s | 44 |
During the most recent reporting year, Western Technical College handed out 44 associate’s degrees in design & applied arts.
Western Wisconsin Technical College is a solid choice among schools offering design & applied arts at the associate’s level. In particular it placed #4 out of 7 schools by College Factual.
The full-time undergraduate tuition and fees are shown below.
| In State | Out of State | |
|---|---|---|
| Tuition | $4,234 | $6,720 |
| Fees | $358 | $358 |
Read more about Western Wisconsin Technical College tuition and fees.
In the most recent graduating class, 48% of design & applied arts associate’s degrees went to men and 52% went to women.
 The largest share of design & applied arts associate’s degree graduates at Western Wisconsin Technical College were White. About 77% of graduates fell into this category.
The following table and chart show the ethnic background for students who recently graduated from Western Technical College with a associate’s in design & applied arts.
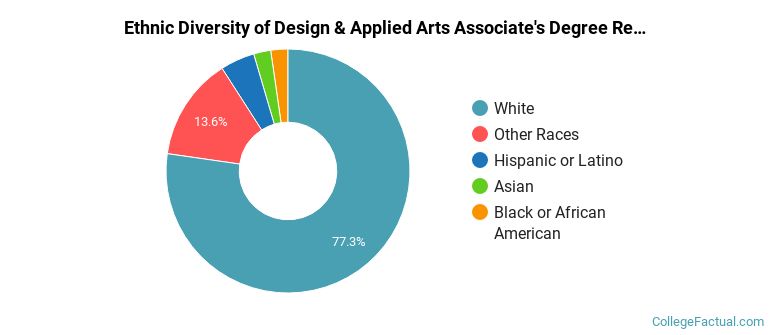
| Ethnic Background | Number of Students |
|---|---|
| Asian | 1 |
| Black or African American | 1 |
| Hispanic or Latino | 2 |
| White | 34 |
| Non-Resident Aliens | 0 |
| Other Races | 6 |
Western Wisconsin Technical College granted 21 associate’s degrees in graphic design recently — 52% to women and 48% to men. Most of these graduates identified as White (81%).
Western Wisconsin Technical College conferred 14 associate’s completions in design and visual communications, general in the most recent reporting year — 21% to women and 79% to men. The most common background among these graduates was White (64%).
Western Wisconsin Technical College granted 9 associate’s degrees in interior design in the most recent reporting year — 100% to women and 0% to men. The largest share of these graduates were White (89%).
More about our data sources and methodologies.