Explore the best ranked schools for the programs you are most interested in.
Whitworth University - Adult Degree Programs landed the #1,980 spot in College Factual's 2025 ranking of best overall colleges in the United States. The higher ed experts analyzed 2,152 colleges and universities across the nation to determine this ranking.
See all of the rankings for Whitworth University - Adult Degree Programs.
The student to faculty ratio at Whitworth University - Adult Degree Programs is about average at 13 to 1. This ratio is often used to gauge how many students might be in an average class and how much time professors will have to spend with their students on an individual level. The national average for this metric is 15 to 1.
During the 2017-2018 academic year, there were 262 undergraduates at Whitworth University - Adult Degree Programs with 42 being full-time and 220 being part-time.
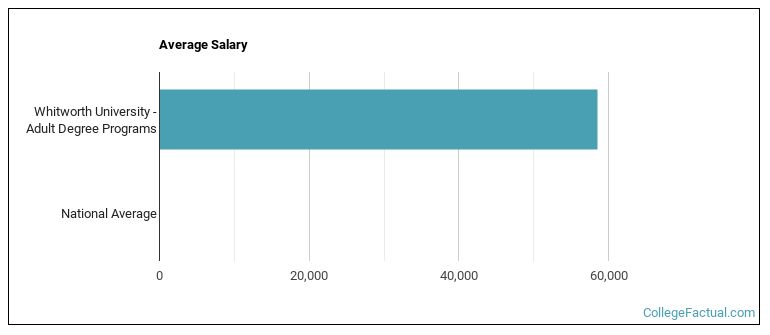
See which majors at Whitworth University - Adult Degree Programs make the most money.
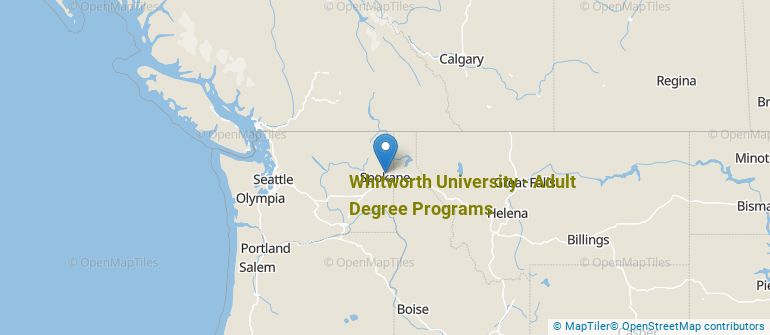
Get more details about the location of Whitworth University - Adult Degree Programs.
Contact details for Whitworth University - Adult Degree Programs are given below.
| Contact Details | |
|---|---|
| Address: | 300 W Hawthorne Rd, Spokane, WA 99251 |
| Phone: | 509-777-1000 |
| Website: | https://www.whitworth.edu/cms/ |
| Most Popular Majors | Bachelor’s Degrees | Average Salary of Graduates |
|---|---|---|
| Liberal Arts General Studies | 56 | $44,645 |
| Business Administration & Management | 20 | $47,241 |
| Teacher Education Grade Specific | 16 | $42,846 |
| Accounting | 3 | $61,021 |
| General Education | 3 | NA |
| Food Science Technology | 0 | NA |
Online courses area a great option for busy, working students as well as for those who have scheduling conflicts and want to study on their own time. As time goes by, expect to see more and more online learning options become available.
In 2022-2023, 103 students took at least one online class at Whitworth University - Adult Degree Programs. This is a decrease from the 124 students who took online classes the previous year.
| Year | Took at Least One Online Class | Took All Classes Online |
|---|---|---|
| 2022-2023 | 103 | 62 |
| 2021-2022 | 124 | 63 |
| 2020-2021 | 19 | 2 |
| 2018-2019 | 10 | 0 |
Learn more about online learning at Whitworth University - Adult Degree Programs.
Footnotes
*The racial-ethnic minorities count is calculated by taking the total number of students and subtracting white students, international students, and students whose race/ethnicity was unknown. This number is then divided by the total number of students at the school to obtain the racial-ethnic minorities percentage.
References
More about our data sources and methodologies.