Whitworth total enrollment is approximately 2,756 students. 2,307 are undergraduates and 167 are graduate students.
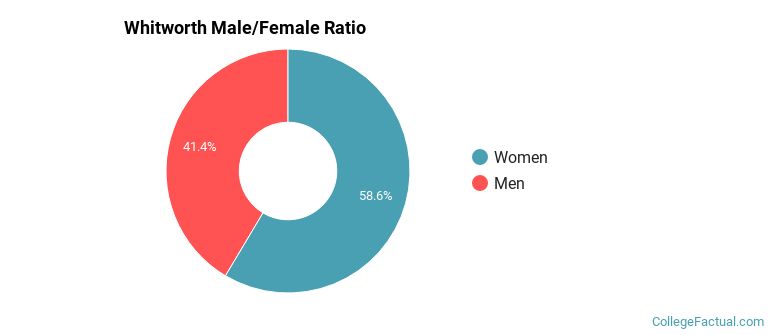
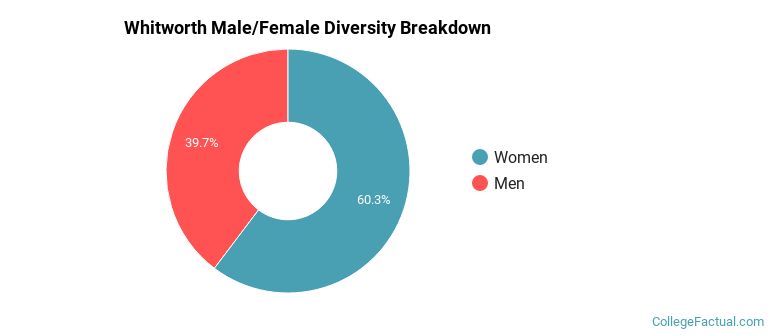
Male/Female Breakdown of Undergraduates
The full-time Whitworth undergraduate population is made up of 60% women, and 40% men.
For the gender breakdown for all students, go here.
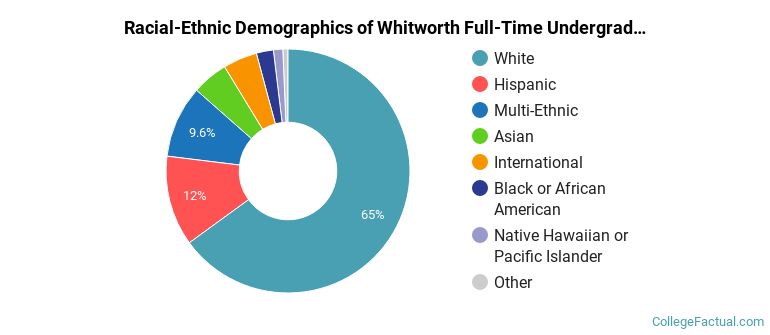
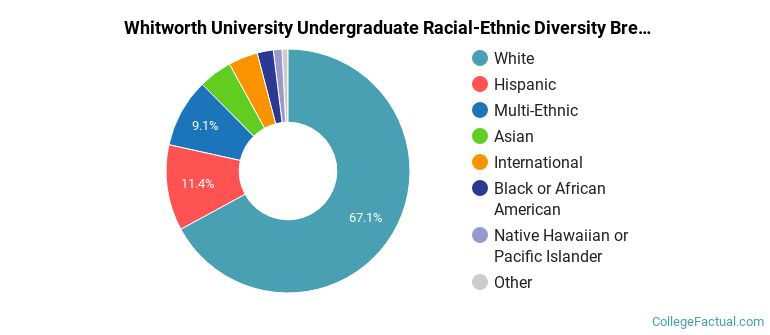
Whitworth Racial/Ethnic Breakdown of Undergraduates
| Race/Ethnicity | Number |
|---|---|
| White | 1,481 |
| Hispanic | 302 |
| Multi-Ethnic | 219 |
| Asian | 103 |
| International | 81 |
| Black or African American | 57 |
| Native Hawaiian or Pacific Islander | 37 |
| Unknown | 11 |
See racial/ethnic breakdown for all students.
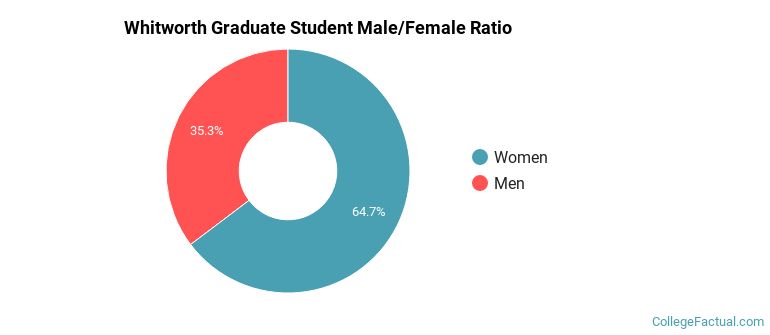
Male/Female Breakdown of Graduate Students
About 64% of full-time grad students are women, and 36% men.
For the gender breakdown for all students, go here.
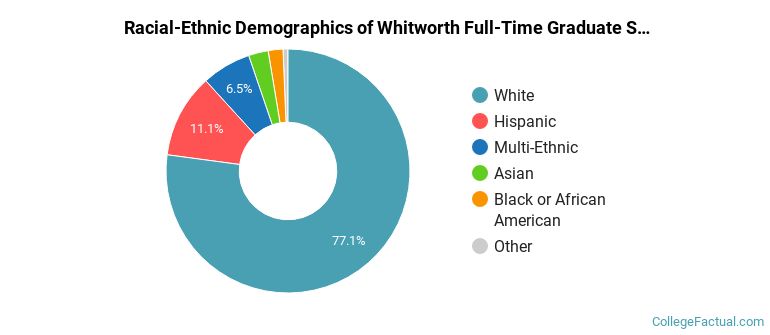
Whitworth Racial-Ethnic Breakdown of Graduate Students
| Race/Ethnicity | Number |
|---|---|
| White | 139 |
| Hispanic | 14 |
| Asian | 6 |
| Multi-Ethnic | 6 |
| Black or African American | 1 |
| International | 1 |
| Native Hawaiian or Pacific Islander | 0 |
| Unknown | 0 |
See racial/ethnic breakdown for all students.
| Race/Ethnicity | Number |
|---|---|
| White | 1,826 |
| Hispanic | 345 |
| Multi-Ethnic | 239 |
| Asian | 118 |
| International | 92 |
| Black or African American | 64 |
| Native Hawaiian or Pacific Islander | 40 |
| Unknown | 16 |
There are approximately 1,689 female students and 1,067 male students at Whitworth.
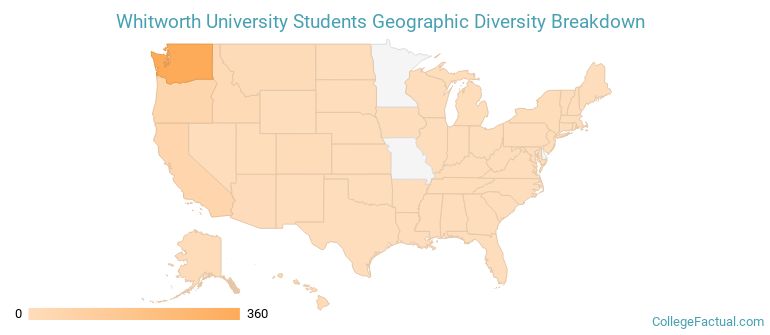
Whitworth ranks 612 out of 2,183 when it comes to geographic diversity.
36.73% of Whitworth students come from out of state, and 4.2% come from out of the country.
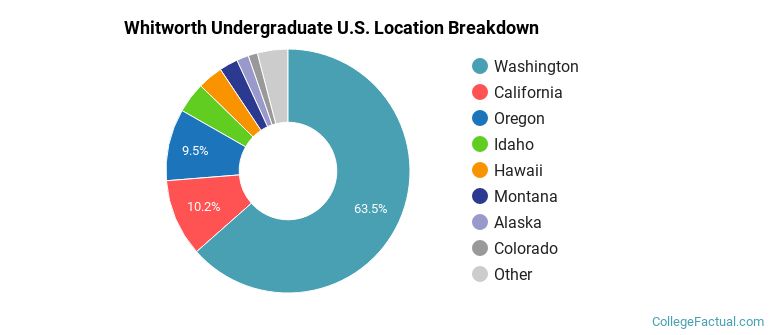
The undergraduate student body is split among 22 states (may include Washington D.C.). Click on the map for more detail.
| State | Amount |
|---|---|
| Washington | 360 |
| California | 58 |
| Oregon | 54 |
| Idaho | 23 |
| Hawaii | 19 |
Students from 46 countries are represented at this school, with the majority of the international students coming from Nigeria, South Korea, and Mongolia.
Learn more about international students at Whitworth.
A traditional college student is defined as being between the ages of 18-21. At Whitworth, 75.83% of students fall into that category, compared to the national average of 60%.
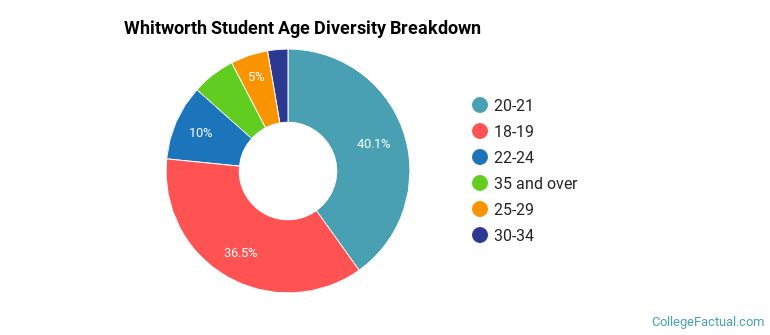
| Student Age Group | Amount |
|---|---|
| 20-21 | 1,043 |
| 18-19 | 949 |
| 22-24 | 260 |
| 35 and over | 150 |
| 25-29 | 129 |
| 30-34 | 70 |
| Under 18 | 0 |
Footnotes
*The racial-ethnic minorities count is calculated by taking the total number of students and subtracting white students, international students, and students whose race/ethnicity was unknown. This number is then divided by the total number of students at the school to obtain the racial-ethnic minorities percentage.
References
Department of Homeland Security Citizenship and Immigration Services
Image Credit: By Charlesdrakew under License
Read College Factual's Diversity Ranking Methodology.