Explore the best ranked schools for the programs you are most interested in.
Wilberforce University was not ranked in College Factual's Best Overall Colleges report this year. This may be because not enough data was available.
Wilberforce University has an acceptance rate of 45%, which means the school is serious about who it admits. Take your time in putting together a strong application that highlights why you are a good fit for Wilberforce University.
About 6% of students accepted to Wilberforce University submitted their SAT scores. When looking at the 25th through the 75th percentile, SAT Evidence-Based Reading and Writing scores ranged between 430 and 470. Math scores were between 410 and 470.
The student to faculty ratio at Wilberforce University is 19 to 1, which is high when compared to the national average of 15 to 1. This may indicate that some of your classes will be larger in size than they would be at other schools. However, upper level classes will probably be smaller.
In addition to the student to faculty ratio, some people look at what percentage of faculty members are full-time as a sign of how much time professors will be able to spend with their students. This is because part-time teachers may not be be on campus as much as their full-time counterparts.
The full-time faculty percentage at Wilberforce University is 40%. This is lower than the national average of 47%.
The freshmen retention rate tells us what percentage of first-year, full-time students choose to continue on to their sophomore year at a particular school. The rate at Wilberforce University is 70%, which is about average when compared to the national rate of 68%.
When we say that a student has graduated on time, we mean that they have finished their bachelor's degree within four years. The on-time graduation rate at Wilberforce University is 9%. That's lower than the national rate of 33.3%
Find out more about the retention and graduation rates at Wilberforce University.
During the 2017-2018 academic year, there were 439 undergraduates at Wilberforce University with 404 being full-time and 35 being part-time.
| $0-30 K | $30K-48K | $48-75 | $75-110K | $110K + |
|---|---|---|---|---|
| $12,339 | $17,071 | $16,834 | $15,112 | $19,883 |
The net price is calculated by adding tuition, room, board and other costs and subtracting financial aid.Note that the net price is typically less than the published for a school. For more information on the sticker price of Wilberforce University, see our tuition and fees and room and board pages.
Almost 66% of college students who graduated with the class of 2018 took out student loans, but that percentage varies from school to school. At Wilberforce University, approximately 47% of students took out student loans averaging $4,822 a year. That adds up to $19,288 over four years for those students.
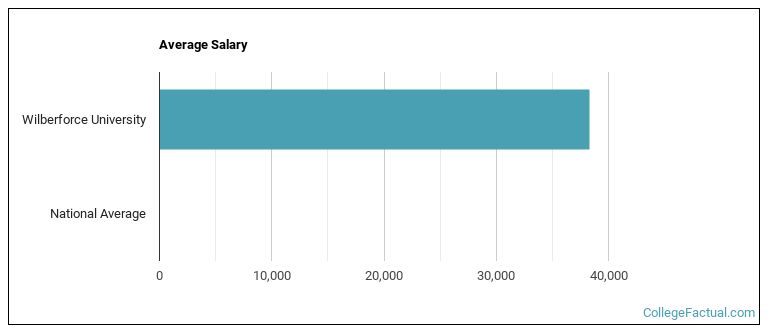
See which majors at Wilberforce University make the most money.
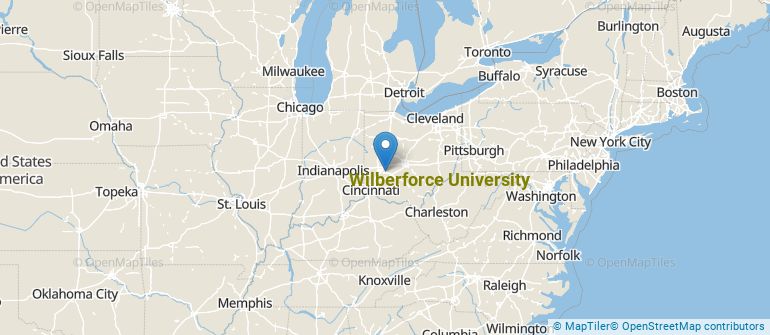
Get more details about the location of Wilberforce University.
Contact details for Wilberforce University are given below.
| Contact Details | |
|---|---|
| Address: | 1055 N Bickett Rd, Wilberforce, OH 45384-1001 |
| Phone: | 937-376-2911 |
| Website: | www.wilberforce.edu/ |
| Most Popular Majors | Bachelor’s Degrees | Average Salary of Graduates |
|---|---|---|
| Business Administration & Management | 15 | NA |
| Social Work | 14 | NA |
| Political Science & Government | 8 | NA |
| Rehabilitation & Therapeutic Professions | 7 | NA |
| General Biology | 6 | NA |
| Accounting | 4 | NA |
| Communication & Media Studies | 4 | NA |
| General Psychology | 4 | NA |
| Marketing | 3 | NA |
| Public Health | 3 | NA |
Online learning options are becoming more and more popular at American colleges and universities. Online classes are great for students who have busy schedules or for those who just want to study on their own time.
In 2022-2023, 55 students took at least one online class at Wilberforce University. This is a decrease from the 62 students who took online classes the previous year.
| Year | Took at Least One Online Class | Took All Classes Online |
|---|---|---|
| 2022-2023 | 55 | 55 |
| 2021-2022 | 62 | 49 |
| 2020-2021 | 0 | 0 |
| 2018-2019 | 6 | 0 |
Footnotes
*The racial-ethnic minorities count is calculated by taking the total number of students and subtracting white students, international students, and students whose race/ethnicity was unknown. This number is then divided by the total number of students at the school to obtain the racial-ethnic minorities percentage.
References
More about our data sources and methodologies.