Wilmington University total enrollment is approximately 14,769 students. 3,107 are undergraduates and 1,046 are graduate students.
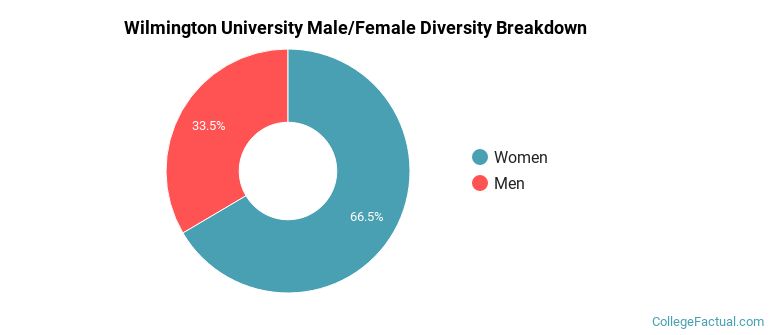
Male/Female Breakdown of Undergraduates
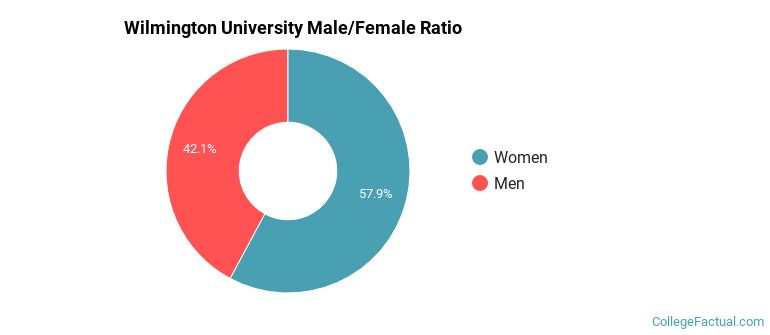
The full-time Wilmington University undergraduate population is made up of 59% women, and 41% men.
For the gender breakdown for all students, go here.
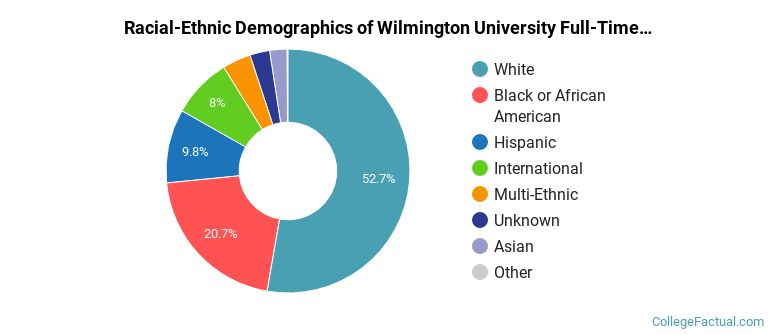
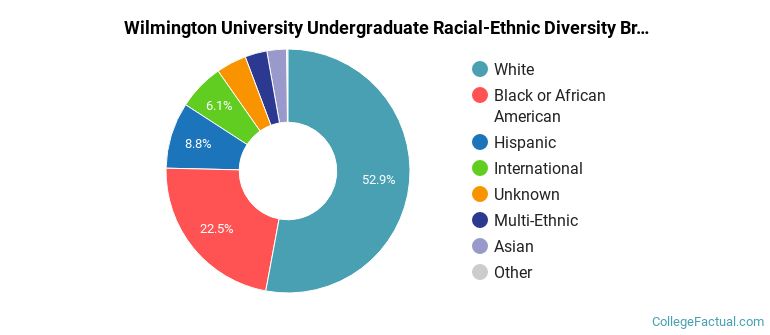
Wilmington University Racial/Ethnic Breakdown of Undergraduates
| Race/Ethnicity | Number |
|---|---|
| White | 1,644 |
| Black or African American | 556 |
| Hispanic | 361 |
| International | 247 |
| Multi-Ethnic | 128 |
| Asian | 82 |
| Unknown | 68 |
| Native Hawaiian or Pacific Islander | 5 |
See racial/ethnic breakdown for all students.
Male/Female Breakdown of Graduate Students
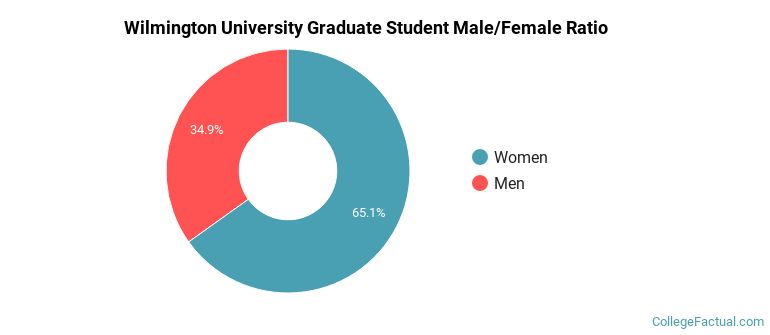
About 65% of full-time grad students are women, and 35% men.
For the gender breakdown for all students, go here.
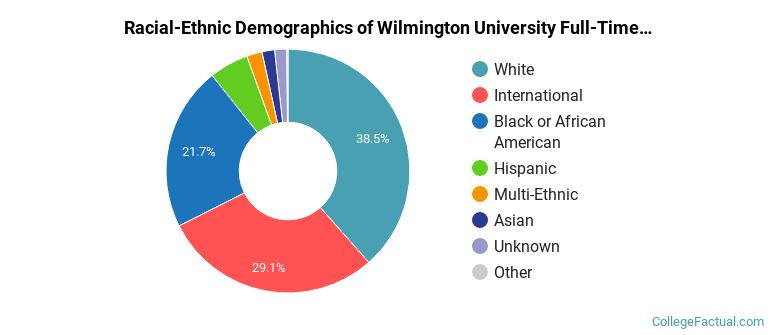
Wilmington University Racial-Ethnic Breakdown of Graduate Students
| Race/Ethnicity | Number |
|---|---|
| White | 458 |
| Black or African American | 241 |
| International | 215 |
| Hispanic | 53 |
| Asian | 26 |
| Multi-Ethnic | 23 |
| Unknown | 18 |
| Native Hawaiian or Pacific Islander | 4 |
See racial/ethnic breakdown for all students.
| Race/Ethnicity | Number |
|---|---|
| White | 7,764 |
| Black or African American | 3,187 |
| Hispanic | 1,501 |
| International | 886 |
| Multi-Ethnic | 472 |
| Unknown | 440 |
| Asian | 411 |
| Native Hawaiian or Pacific Islander | 31 |
There are approximately 9,785 female students and 4,984 male students at Wilmington University.
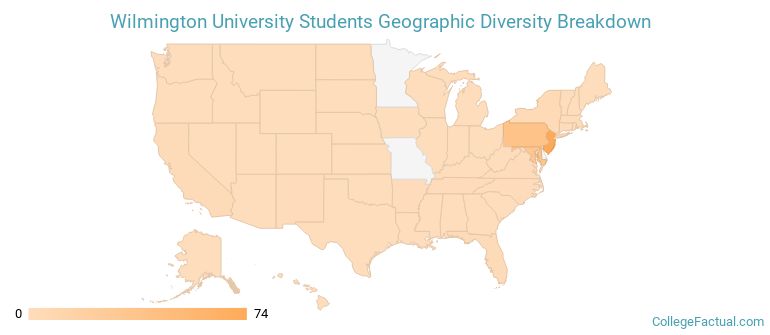
Wilmington University ranks 1,300 out of 2,183 when it comes to geographic diversity.
24.34% of Wilmington University students come from out of state, and 0% come from out of the country.
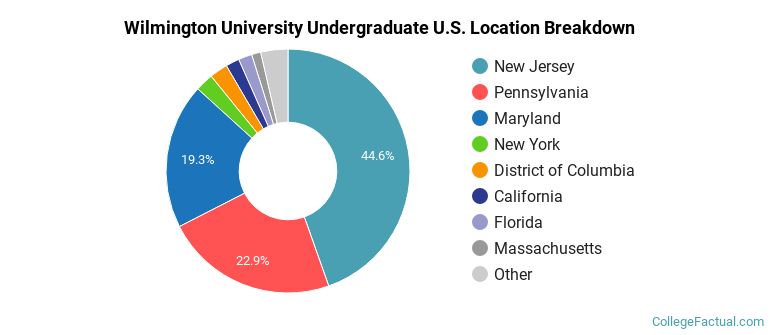
The undergraduate student body is split among 14 states (may include Washington D.C.). Click on the map for more detail.
| State | Amount |
|---|---|
| New Jersey | 74 |
| Pennsylvania | 38 |
| Maryland | 32 |
| District of Columbia | 4 |
| New York | 4 |
Students from 77 countries are represented at this school, with the majority of the international students coming from India, Nepal, and Bangladesh.
Learn more about international students at Wilmington University.
A traditional college student is defined as being between the ages of 18-21. At Wilmington University, 10.11% of students fall into that category, compared to the national average of 60%.
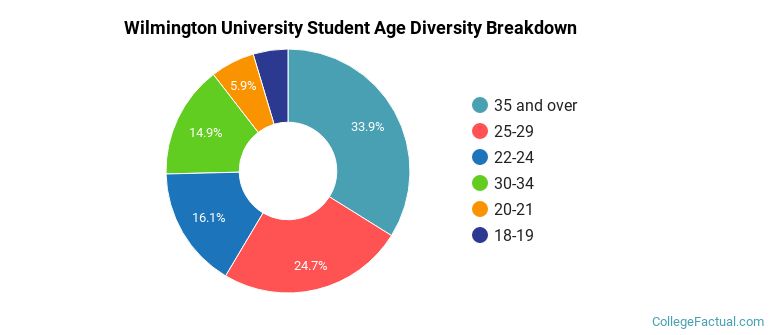
| Student Age Group | Amount |
|---|---|
| 35 and over | 4,632 |
| 25-29 | 3,372 |
| 22-24 | 2,198 |
| 30-34 | 2,039 |
| 20-21 | 802 |
| 18-19 | 631 |
| Under 18 | 0 |
Footnotes
*The racial-ethnic minorities count is calculated by taking the total number of students and subtracting white students, international students, and students whose race/ethnicity was unknown. This number is then divided by the total number of students at the school to obtain the racial-ethnic minorities percentage.
References
Department of Homeland Security Citizenship and Immigration Services
Image Credit: By Chris Light under License