Here, you'll find out more about the major, including such details as the number of graduates, what degree levels are offered, ethnicity of students, and more. In addition, we cover how Windward CC ranks in comparison to other schools with natural sciences programs.
Go directly to any of the following sections:
The natural sciences major at Windward CC is not ranked on College Factual’s Best Colleges and Universities for Natural Sciences. This could be for a number of reasons, such as not having enough data on the major or school to make an accurate assessment of its quality.
Out-of-state part-time undergraduates at Windward CC paid an average of $345 per credit hour in 2022-2023. The average for in-state students was $131 per credit hour. The average full-time tuition and fees for undergraduates are shown in the table below.
| In State | Out of State | |
|---|---|---|
| Tuition | $3,144 | $8,280 |
| Fees | $50 | $50 |
| Books and Supplies | $1,350 | $1,350 |
Learn more about Windward CC tuition and fees.
Online degrees for the Windward CC natural sciences bachelor’s degree program are not available at this time. To see if the school offers distance learning options in other areas, visit the Windward CC Online Learning page.
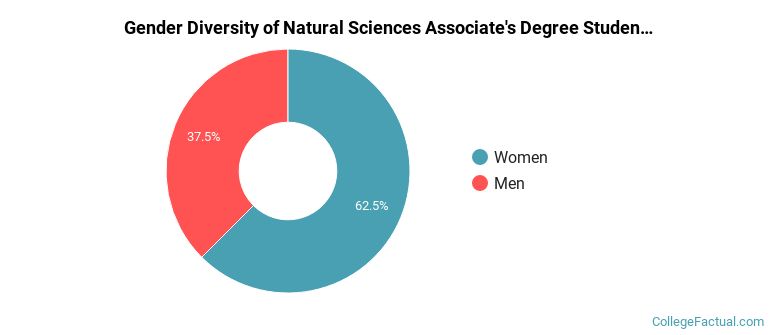
During the 2021-2022 academic year, 16 students graduated with a associate's degree in natural sciences from Windward CC. About 38% were men and 63% were women.
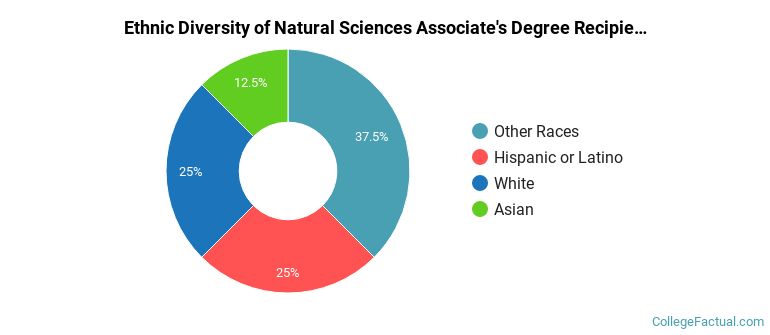
The following table and chart show the ethnic background for students who recently graduated from Windward Community College with a associate's in natural sciences.
| Ethnic Background | Number of Students |
|---|---|
| Asian | 2 |
| Black or African American | 0 |
| Hispanic or Latino | 4 |
| White | 4 |
| Non-Resident Aliens | 0 |
| Other Races | 6 |