Wingate total enrollment is approximately 3,653 students. 2,602 are undergraduates and 760 are graduate students.
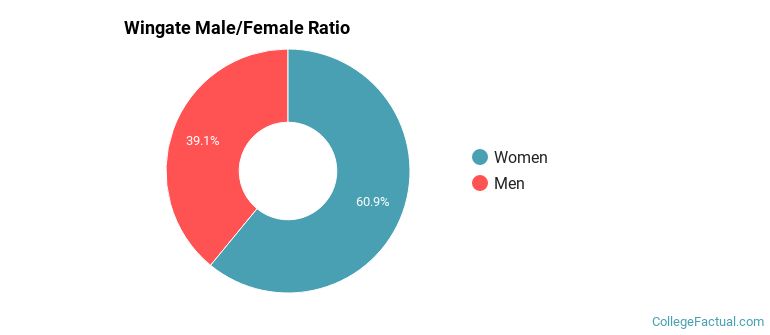
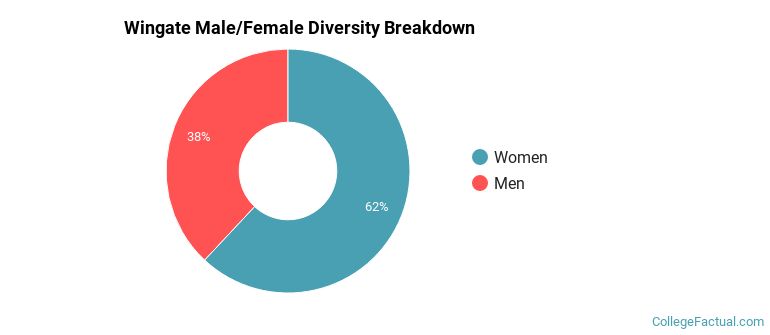
Male/Female Breakdown of Undergraduates
The full-time Wingate undergraduate population is made up of 61% women, and 39% men.
For the gender breakdown for all students, go here.
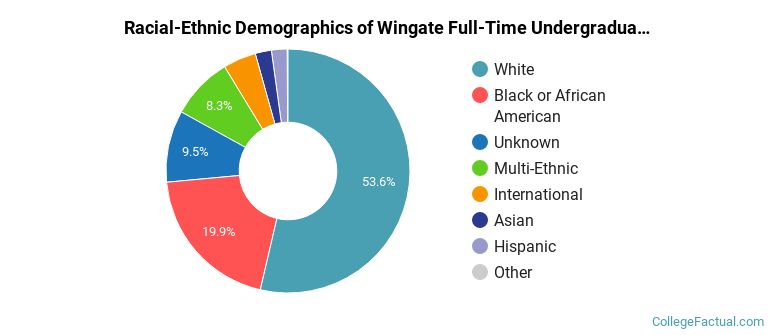
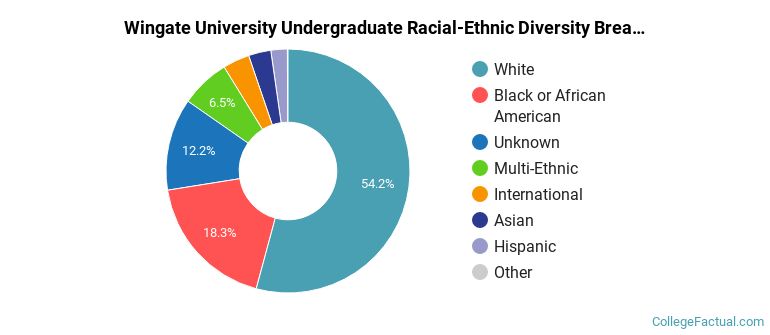
Wingate Racial/Ethnic Breakdown of Undergraduates
| Race/Ethnicity | Number |
|---|---|
| White | 1,339 |
| Black or African American | 585 |
| Multi-Ethnic | 220 |
| Hispanic | 187 |
| International | 109 |
| Unknown | 95 |
| Asian | 54 |
| Native Hawaiian or Pacific Islander | 4 |
See racial/ethnic breakdown for all students.
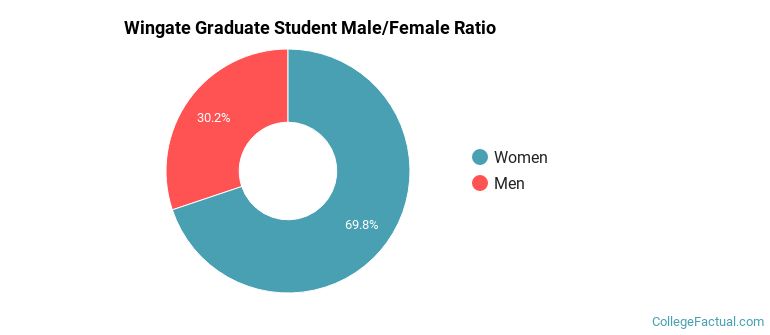
Male/Female Breakdown of Graduate Students
About 71% of full-time grad students are women, and 29% men.
For the gender breakdown for all students, go here.
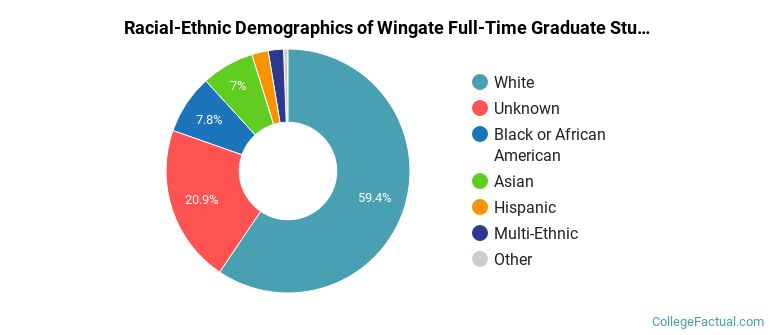
Wingate Racial-Ethnic Breakdown of Graduate Students
| Race/Ethnicity | Number |
|---|---|
| White | 547 |
| Black or African American | 82 |
| Asian | 60 |
| Hispanic | 22 |
| Multi-Ethnic | 20 |
| Unknown | 18 |
| International | 6 |
| Native Hawaiian or Pacific Islander | 0 |
See racial/ethnic breakdown for all students.
| Race/Ethnicity | Number |
|---|---|
| White | 2,017 |
| Black or African American | 744 |
| Multi-Ethnic | 249 |
| Hispanic | 216 |
| Unknown | 161 |
| International | 127 |
| Asian | 119 |
| Native Hawaiian or Pacific Islander | 4 |
There are approximately 2,279 female students and 1,374 male students at Wingate.
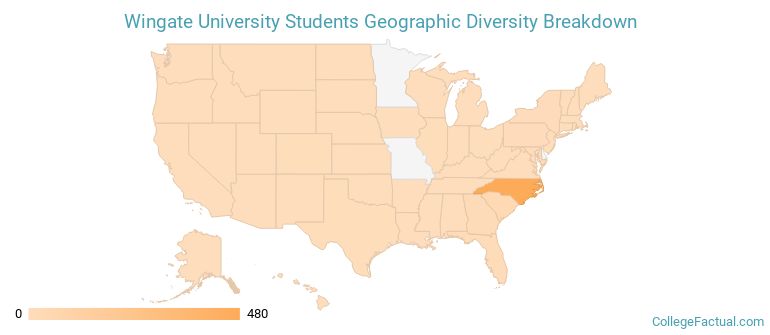
Wingate ranks 1,087 out of 2,183 when it comes to geographic diversity.
20.53% of Wingate students come from out of state, and 3.36% come from out of the country.
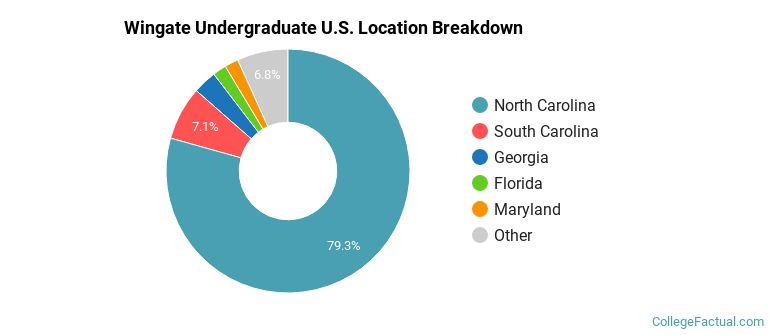
The undergraduate student body is split among 22 states (may include Washington D.C.). Click on the map for more detail.
| State | Amount |
|---|---|
| North Carolina | 480 |
| South Carolina | 43 |
| Georgia | 19 |
| Florida | 11 |
| Maryland | 11 |
Students from 51 countries are represented at this school, with the majority of the international students coming from United Kingdom, Germany, and Canada.
Learn more about international students at Wingate.
A traditional college student is defined as being between the ages of 18-21. At Wingate, 63.73% of students fall into that category, compared to the national average of 60%.
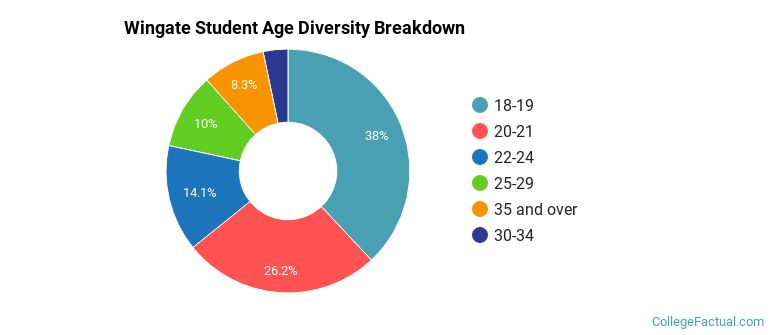
| Student Age Group | Amount |
|---|---|
| 18-19 | 1,366 |
| 20-21 | 941 |
| 22-24 | 508 |
| 25-29 | 361 |
| 35 and over | 299 |
| 30-34 | 118 |
| Under 18 | 0 |
Footnotes
*The racial-ethnic minorities count is calculated by taking the total number of students and subtracting white students, international students, and students whose race/ethnicity was unknown. This number is then divided by the total number of students at the school to obtain the racial-ethnic minorities percentage.
References
Department of Homeland Security Citizenship and Immigration Services
Image Credit: By Ã§Å’Å¤Ã§Å’Å¤Ã§Å¡â€žÄ‡â€“Ä½Ä Å½Â°Ä‡Å"Ź under License