Here, you'll find out more about the major, including such details as the number of graduates, what degree levels are offered, ethnicity of students, average salaries, and more. In addition, we cover how WSSU ranks in comparison to other schools with rehabilitation programs.
Jump to any of the following sections:
The bachelor's program at WSSU was ranked #236 on College Factual's Best Schools for rehabilitation list. It is also ranked #7 in North Carolina.
During the 2021-2022 academic year, Winston - Salem State University handed out 50 bachelor's degrees in rehabilitation & therapeutic professions. This is an increase of 39% over the previous year when 36 degrees were handed out.
In 2022, 40 students received their master’s degree in rehabilitation from WSSU. This makes it the #93 most popular school for rehabilitation master’s degree candidates in the country.
In addition, 64 students received their doctoral degrees in rehabilitation in 2022, making the school the #76 most popular school in the United States for this category of students.
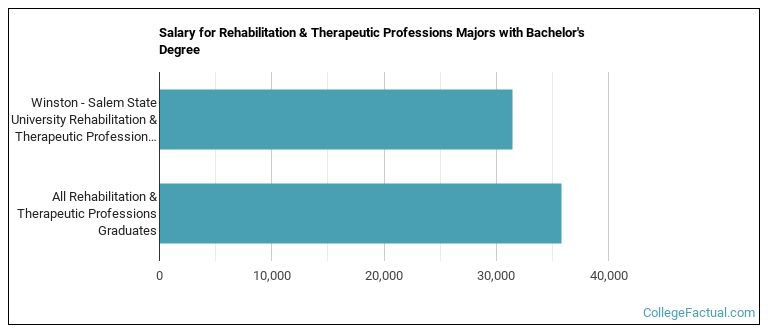
Rehabilitation majors who earn their bachelor's degree from WSSU go on to jobs where they make a median salary of $31,421 a year. This is less than $35,786, which is the national median of all rehabilitation majors in the nation who earn bachelor's degrees.
The typical student loan payment of a bachelor's degree student from the rehabilitation program at WSSU is $138 per month.
During the 2022-2023 academic year, part-time undergraduate students at WSSU paid an average of $586 per credit hour if they came to the school from out-of-state. In-state students paid a discounted rate of $142 per credit hour. The following table shows the average full-time tuition and fees for undergraduates.
| In State | Out of State | |
|---|---|---|
| Tuition | $3,401 | $14,057 |
| Fees | $3,334 | $3,334 |
| Books and Supplies | $1,690 | $1,690 |
| On Campus Room and Board | $11,484 | $11,484 |
| On Campus Other Expenses | $3,492 | $3,492 |
Learn more about WSSU tuition and fees.
Of the 50 students who earned a bachelor's degree in Rehabilitation & Therapeutic Professions from WSSU in 2021-2022, 6% were men and 94% were women.

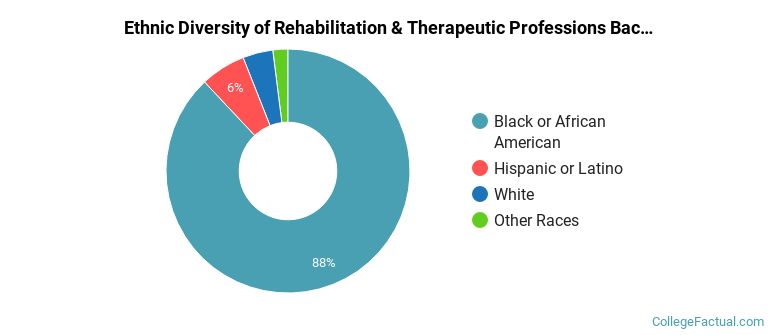
The majority of the bachelor's degree graduates for this major are black or African Americans. About 88% of grads fell into this category.
The following table and chart show the ethnic background for students who recently graduated from Winston - Salem State University with a bachelor's in rehabilitation.
| Ethnic Background | Number of Students |
|---|---|
| Asian | 0 |
| Black or African American | 44 |
| Hispanic or Latino | 3 |
| White | 2 |
| Non-Resident Aliens | 0 |
| Other Races | 1 |
WSSU does not offer an online option for its rehabilitation bachelor’s degree program at this time. To see if the school offers distance learning options in other areas, visit the WSSU Online Learning page.
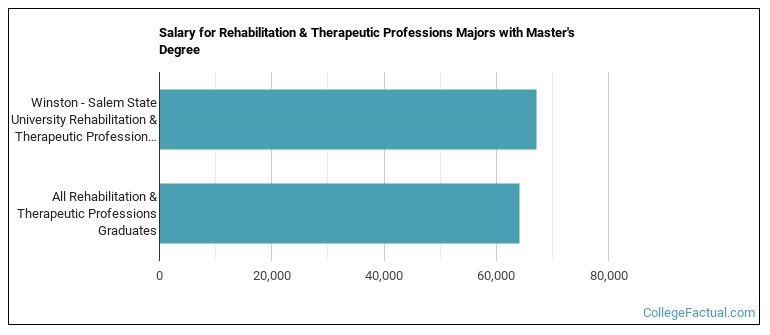
Rehabilitation majors graduating with a master's degree from WSSU make a median salary of $67,097 a year. This is a better than average outcome since the median salary for all rehabilitation graduates with a master's is $64,132.
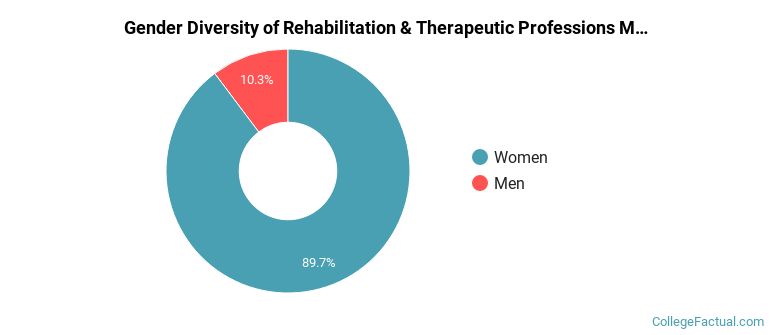
During the 2021-2022 academic year, 39 rehabilitation majors earned their master's degree from WSSU. Of these graduates, 10% were men and 90% were women.
The majority of the master's degree graduates for this major are black or African Americans. About 51% of grads fell into this category.
The following table and chart show the ethnic background for students who recently graduated from Winston - Salem State University with a master's in rehabilitation.
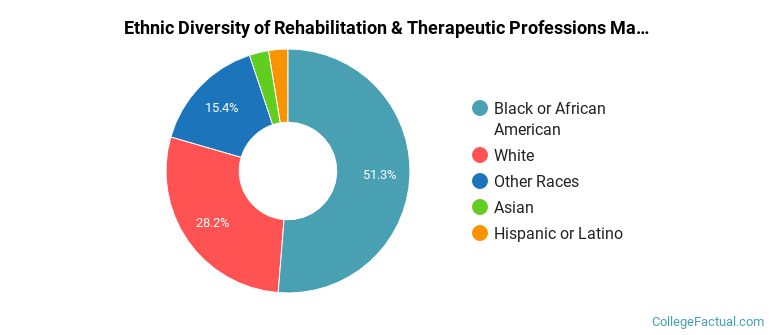
| Ethnic Background | Number of Students |
|---|---|
| Asian | 1 |
| Black or African American | 20 |
| Hispanic or Latino | 1 |
| White | 11 |
| Non-Resident Aliens | 0 |
| Other Races | 6 |
Take a look at the following statistics related to the make-up of the rehabilitation majors at Winston - Salem State University.
| Related Major | Annual Graduates |
|---|---|
| Nursing | 250 |
| Health & Medical Administrative Services | 117 |
| Clinical/Medical Laboratory Science | 53 |
View All Rehabilitation & Therapeutic Professions Related Majors >
More about our data sources and methodologies.